For years now, Warren Buffett‘s name has been nearly synonymous with the term 'value investing'. A disciple of Benjamin Graham, the man known as the 'Father of Value Investing', Buffett has become the world’s most well-known investor thanks to his ability to ascertain the value of various securities and then buy them for less, a concept at the core of value investing. 'Price,' he has said, 'is what you pay. Value is what you get.'
But to label Buffett a 'value investor' is probably an oversimplification. In reality, his strategy involves several different factors. In fact, in a recent paper, three members of AQR Capital Management found that value is not what has driven Buffett’s success over the past few decades. 'The standard academic factors that capture the market, size, value and momentum premia cannot explain Buffett’s performance so it has to date been a mystery,' write Andrea Frazzini, David Kabiller, and Lasse H. Pedersen.
But in their study, they say, they 'find that the secret to Buffett’s success is his preference for cheap, safe, high-quality shares combined with his consistent use of leverage to magnify returns while surviving the inevitable large absolute and relative draw downs this entails.'
They estimate that Buffett applies about 1.6-to-1 leverage, financed in part by the Berkshire’s insurance float. They also find that Berkshire Hathaway‘s public holdings over the 1980-2011 period averaged a beta of 0.77, meaning that they tended to be a good deal less volatile than the broader market.
After studying Buffett for more than a decade, I wasn't too surprised that high-quality, safer picks are responsible for his success. My Buffett-inspired share analysis strategy, which is based on the approach Buffett used to build his empire, puts just as much (if not more) emphasis on quality and stability than it does on value metrics, and quality shares tend to be less volatile.
My strategy looks for companies that have increased earnings per share in all or almost all years of the past decade at a stable rate; have enough annual earnings that they could, if need be, pay off all their debt within five years; and which have averaged returns on equity of at least 18% over the past 10 years–all signs of very high-quality businesses.
Whatever you want to call it, value investing, high-quality investing, low-beta investing high-quality-low-beta value investing, Buffett’s impeccable track record shows that his approach is well worth following.
Ever wonder what shares on the JSE Warren Buffett, Benjamin Graham and other Guru Value Investors would consider close to the perfect share? I have scanned the JSE using the investment strategies of various Value Investment Guru’s to answer that question. In total I used 6 different strategies by, respectively, Warren Buffett, Benjamin Graham, Peter Lynch, Martin Zweig, Kenneth Fisher, and James O’Shaughnessy. The reason I chose these gentlemen is because they are all considered Gurus of Value Investing past and present. Of the 6 Value Investors Buffett and Graham are considered more traditional, or patient, investors. Lynch, Zweig and O’Shaughnessy are all considered growth Value Investors and Fisher is considered a price-to-sales Value Investor. Although all the investment approaches of the investors listed stem from Benjamin Graham’s original approach, they all have their own unique approach to valuing shares.
The broad based scan of the JSE, using the 6 approaches, yielded some interesting results. Before sharing the results let me start with some general comments. I evaluated each share on the JSE using all 6 strategies and for each strategy I sampled the top ten shares based on the strategies’ screening criteria. Thus, from the evaluation I picked a total of 60 shares. However, many strategies sampled the same shares and therefore, amongst the 60 shares, only 39 unique shares were sampled. I found little correlation between the shares sampled using the different strategies, however, I did notice distinct differences between the shares selected by the growth versus the patient value investment strategies. Also, I noticed a high resource focus using the Peter Lynch strategy.
Every investor would love to own the perfect share. But did the screening find a share that is everything to all 6 the Guru investors? The short answer is no, but almost. The primary reason for this is the different focus areas, or approaches, of the different investors. The patient investors focus on balance sheet and income statement, whereas the growth investors are slightly more income statement focussed. Furthermore, if the strategies only had one or two criteria I would find many shares complying, but the strategies followed by these Gurus are comprehensive and include, amongst other, the following important criteria:
Earning, Sales and Book Value. Most of the Guru’s focus on consistency and stability of year-on-year earnings, sales and book value. These are critical factors for all the patient investors.
Money making opportunities. Return on equity helps measure how well a firm is finding opportunities to turn its resources into profitable business endeavours.
Growth. Companies following an active reinvestment strategy show healthy revenue and EBIT growth. Furthermore, firms that grow while having ROICs higher than their cost of capital create value for shareholders at an accelerated pace. The patient investors focussed on firms that are within the mature growth to mature life cycle stages, whereas the growth investors picked shares that are within the growth to mature growth life cycle stages.
Balance Sheet. At businesses with a lot of debt, banks and bondholders compete with shareholders for management's attention. Firms with strong balance sheets don't have to worry about the distraction of debt.
Dividends. Firms with a strong balance sheet paying consistent dividends will yield great value over time, especially if it is done without sacrificing reinvestment and thus future growth.
Ratios. Various ratios used for fundamental analysis play a key role and only firms with above average values per ratio are included in the samples.
Given these criteria, it would be unlikely that a single share would comply perfectly with the criteria of all 6 strategies, but there are a couple of shares, in fact only 5 from the entire JSE, that come very close. My guess is that you would expect to find these 5 shares listed in the Top 40 Index, but you would be wrong. On the contrary, it is more likely that you are unfamiliar with these 5 shares. From the 5 I picked my personal favourite, Bowler Metcalf (ticker symbol BCF). No share is a sure thing, but the 6 Guru’s and I think BCF is closer to perfect that many others. Let’s take a closer look at BCF by briefly analysing it based on the Buffett, Graham and Fisher valuation criteria.
I’ll start with Buffett’s criteria:
Factor
What the Guru wants to see
Pass or Fail
Earnings predictability
A firm with solid, stable earnings that are continually expanding
Pass
The ability to pay off debt
BCF could use its EBIT and pay off its debt in less than two years, which is considered exceptional
Pass
Consistently higher than average return on equity
A firm with above average return on equity of at least 18% or better over a ten year period.
Pass
Consistently higher than average return on total capital
Some firms can be financed with debt that is many times their equity, they can show a consistently high ROE, yet still be in unattractive price competitive businesses. Furthermore, the firms return on total capital should be consistently higher than the cost of capital to create value
Pass
Positive Free Cash Flow
The firm should not reinvest more money than the profit it generates, to ensure positive FCFs
Pass
Management's use of retained earnings
It’s important to understand how management has spent retained earnings in a way that benefits shareholders. The cumulative retained earnings over the previous ten years are used, together with the gain in EPS over the same period, to calculate a return on earnings retained.
Pass
Share buybacks
The firm should have been repurchasing shares when the opportunity presented itself, i.e., when the shares’ intrinsic value was trading at a discount to price
Pass
Expected long-term compound annual growth rate
Based on the current conservative fundamentals the firm should project an annual compounding rate of return, over the next ten years, of at least 15% or better
Pass
Next I analyse BCF using Graham’s criteria:
Factor
What the Guru wants to see
Pass or Fail
Sales
The firm should have annual sales greater than R 500 million
Pass
Current ratio
The current ratio must be greater than or equal to 2
Pass
Long-term debt in relation to net current assets
Long-term debt must not exceed net current assets (current assets minus current liabilities)
Pass
Long-term EPS growth
Firms must increase their EPS by at least 30% over a ten-year period and EPS must not have been negative for any year within the last 5 years
Pass
P/E ratio
The Price/Earnings (P/E) ratio, based on the greater of the current PE or the PE using average earnings over the last 3 fiscal years, must be ‘moderate’, which this methodology states is not greater than 15
Pass
P/B ratio
The Price/Book multiplied by P/E cannot be greater than 22
Pass
Finally I analyse BCF using O’Shaughnessy’s Cornerstone Growth Strategy criteria:
Factor
What the Guru wants to see
Pass or Fail
Market Cap
The first requirement of the strategy is that the firm has a market capitalization of at least R 500 million
Pass
Earnings per share persistence
The methodology looks for companies that show persistent earnings growth without regard to magnitude. BCF has shown long term earnings growth, except for the last financial year.
Pass
Price/sales ratio
The Price/Sales ratio should be below 1.5
Pass
Relative strength
The final criterion for the strategy requires that the Relative Strength of the firm be among the top 50 of the shares screened using the previous criterion. BCF is number 29 on this list.
Pass
Based on the above these three Guru’s consider BCF to be one of the few perfect shares on the JSE. BCF also complies with at least 70% of the criteria stipulated by Lynch, Zweig and Fisher, which is why its one of the 5 ‘close-to-perfect’ value investing shares on the JSE. All this said, I am one with little faith and therefore, before making a decision to invest in a share, I apply some additional criteria. This includes a qualitative valuation of the firm’s management, competitive advantage, and finally an intrinsic valuation based on a discounted cash flow valuation. If I believe the share’s intrinsic value is close to, or at a discount to, its quoted share price I will purchase it in a heartbeat and hold on to it for as long as economics dictate.
Bowler Metcalf may not be perfect, but there are always some other shares you might like better. I encourage you to join an investment club and actively participate in screening, analysing and valuing firms in search of the perfect investment.
The old saying goes that when in Rome, do like the Romans do, it might just serve you well. At this point you’re probably thinking “I know that saying but so what?” Well, if you are like me, you are not one of the lucky few trotting the globe and visiting Rome all that often. Rather, you spend your every minute here in sunny South Africa enjoying the many things this great country has to offer. At this point I’ll hazard a guess that you, like me, are in a position where it seems the one thing you don’t have much of these days is disposable income. The bottom line is the South African citizen is under considerable financial pressure and it does not seem like there is much hope of things changing any time soon.
Did you know that all of us hold dual citizenship? We are not just a citizens of South Africa we are also citizens of an empire that spans the globe. We are part of the interconnected capitalist economy, or as I like to call it Capitalazia. In Capitalazia the primary medium of exchange is information and the primary driver of value is appliedknowledge. Companies like Google, Facebook, Twitter, and Amazon Kindle provide striking examples of how relevant and valuable information exchange has become, but they have just taken the first steps. Further, the forthcoming revolution in 3D printing is a perfect example of applied knowledge in action and it will change the entire world as we know it. Capitalazia is every bit as alive and rich in treasures as any real undiscovered land our forefathers explored in search of wealth and opportunity.
I’ll be the first to admit that the capitalist system is fraught with many problems and challenges, but on the whole it has elevated the poor and oppressed more so than any other ideology ever. Capitalism is a system which allows people to live their dreams, empowers them, and allows for new comforts and prosperity to be created. However, to benefit and prosper in Capitalazia you have to understand the concept of economic group selection - those in the group that best apply knowledge will come out top.
So what does all of this have to do with us? The simple answer is everything! As citizens of South Africa we are all continuously growing poorer and have less and less disposable income. We have to accept that our only chance of turning our situation around is to start “doing like the Capitalazians do”. The speed of our wealth destruction depends on many factors, which includes politics, resource availability, population growth, etc., but also our inability to behave like capitalists. Therefore, to start creating wealth we have to focus on that last factor because all the other are largely exogenous we can’t do much about.
The good news is that as far as I know capitalists don’t have any secret success recipes. They simply accept full responsibility for their own financial futures. They use their brains to generate ideas. They surround themselves with other people who think like they do and exchange and refine their ideas with those people. They think long-term. Finally, they apply their ideas.
There it is. The secret is out. All you have to do is manage your emotions and follow the steps of the recipe. Step one is the hardest. If you can overcome your fears and anxieties and take this giant leap you’re on your way to becoming a successful citizen of Capitalazia. The easiest way I know to take step one is to mimic an alcoholic who joins AA. In other words, ignore your fears and reservations and join capitalist anonymous, or as I prefer to call it, an investment club. Group dynamics tell us that once you have found this group of likeminded capitalist citizenry your chances of achieving success increases dramatically as compared to a lone ranger.
Step two is to switch on your brain, start generating ideas and applying your knowledge. If this takes you back to your high school math class then relax. That kind of smart is not the only kind of smart that is rewarded in Capitalazia. You’re not expected to dream up the next iPod or invent a cure for cancer. Rather think applied knowledge in the form of Warren Buffett and Value Investing. He did not invent Value Investing, but he used healthy reasoning, logic and applied knowledge to benefit from long-term investing. Even though he never invented a cure for cancer I would say he did OK.
So where is the catch you ask? Well, to invest you need money, but now we are back to where we started and the lack of disposable income. If you think this is the major stumbling block in the entire argument then you would not be alone, but you would be wrong. Every member that has ever joined our investment club feels the same way, but not for long. Once you start thinking and studying wealth creation you naturally start participating and contributing to the group and then a strange thing happens. You pick up ideas about how to creatively find the resources you need to invest. You actively start applying your mind and either start saving or generating disposable income, which allows you to invest towards wealth creation.
Therefore, just like a gym partner helps you stay focussed and motivates you to hit the gym rather than the couch, so too your investment club will help you stay focussed. There are many benefits to joining a club. For instance, in an investment club you don’t have to do all the thinking and applying yourself. Also, people that pool their reasoning usually make far better decisions, are less emotionally volatile, and more likely to take action, than the lone rangers that keep their ideas to themselves. The bottom line is that by surrounding yourself with fellow capitalists working towards reaching the top, you will start acting more like a capitalist yourself, and this might just serve you well.
In 1984 Warren Buffett gave a speech at Columbia Business School at a seminar marking the 50th anniversary of the publication of Benjamin Graham and David Dodd’s Security Analysis. He speech, titled the Superinvestors from Graham-and-Doddsville, focussed on the extraordinary success achieved by a group of value investors. Prior to the publication of Graham and Dodd’s Security Analysis in 1934 the definition of an investor was practically equal to that of a speculator. Graham and Dodd’s work lay down an approach to investing which influenced a group of people of whom some became The Superinvestors.
Some of the greatest (first generation) value investors worked for or with Benjamin Graham. Others attended Columbia Business School, taking courses with either Graham or his successors. The second generation mentioned here, in turn, worked for or with some of the first generation. The world of value investing extends far beyond the group portrait of people here. Similarly, the styles of value investing have diverged since 1934. For instance, some value investors profiled here only invest in superior businesses that they intend to own for decades. Others are looking for damaged goods discarded by the markets, even though the assets or businesses are still worth something. Finally, there are many great value investors not mentioned here, they include the late Max Heine, manager of Mutual Shares, John Neff, Charles Royce, and many others.
Warren Buffett
Few will dispute the claim that Warren Buffett is the most illustrious investor ever. The exceptional returns he has earned for his shareholders over more than four decades speak for themselves. The ‘Oracle of Omaha’, as he is known, achieved a 21.4% compound annual per-share book value gain between 1965 and 2006. Buffett’s key approach is that as investor and businessman he looks at ownership in exactly the same way. He always focusses on the business and the management to understand intrinsic value. Ask him and he’ll say that he simply buys great companies at good prices.
Glenn Greenberg
Greenberg studied English Literature, but after an MBA at Columbia University he took a position at J.P. Morgan. Greenberg and John Shapiro founded Chieftain Capital Management in 1984. By pursuing a disciplined investment strategy, Chieftain compounded its accounts at 22.5% during the period from 1984 through 2004 versus 12.9% for the S&P 500. Chieftain maintained a highly concentrated portfolio with no more than 15 to 17 shares in its entire portfolio at all times.
Seth Klarman
He started his career as an intern at the Mutual Shares Corporation that was managed by Max Heine and Michael Price. In 1982 Seth Klarman founded the Baupost Group with an initial investment of $27 million from four wealthy and prominent Boston-based families. Today, after an astounding gross return of 20% per year and only one negative year, the group boasts assets of $24 billion and places among the top ten hedge funds both in size and long-term returns. Klarman invests in a wide array of investments ranging from fairly traditional value stocks to more esoteric investments like distressed debt, liquidations, and foreign equities or bonds.
Mario Gabelli
He graduated from Columbia Business School in 1967. After ten years on Wall Street he founded Gabelli Asset Management in 1977. Today the firm is a global investment fund that manages in excess of $30 billion in mutual funds, separate accounts for individuals and institutions, and private investment partnerships. Gabelli, who established the term and approach called Private Market Value, based on traditional Graham principals, follows a diversified approach with more than 600 shares in his GAMCO Investors portfolio.
Michael Price
He started working for Max Heine in 1975. After Heine died in 1988 Price took over Heine Securities. Price earned a reputation as an activist value investor, similar to Carl Icahn. He buys undervalued companies and then gets involved in fixing them, where he often tussles with management of companies held in his portfolios. He sold Heine Securities in 1996 to Franklin Resources and now he manages the private firm MFP Investors.
Peter Lynch
Lynch graduated from Boston College in 1965 with a degree in finance. After completing an MBA in 1968 he started working at Fidelity Investments as an investment analyst. In 1977 Lynch was named manager of the little known Magellan Fund. He managed the fund from 1977 to 1990 (when he retired), during which time the fund's assets grew from $20 million to $14 billion. More importantly, Lynch beat the S&P 500 Index benchmark in 11 of those 13 years, achieving an annual average return of 29%. He is known as a growth value investor and recognised author of a number of value investing books.
Joel Greenblatt
Greenblatt graduated from the University of Pennsylvania in 1979 and an MBA in 1980. In 1985 he started the hedge fund Gotham Capital with $7 million. Greenblatt is a value investor that buys (as he calls it) ‘cheap and good companies’ with a high earnings yield and a high return on invested capital. He keeps his portfolio very concentrated and buys at deep discounts to intrinsic value. He is also a value investor author and now Adjunct Professor at Columbia Business School.
Walter and Edwin Schloss
Walter Schloss was a well-regarded value investor, a notable disciple of the Benjamin Graham. He took class from Graham and later worked for him at Graham-Newman. He started his own limited partnership in mid-1955. He, and now his son Edwin, follow the ‘keep it simple and cheap’ approach to investing as originally defined by Bejamin Graham. Walter Schloss raked up an impressive return averaging a 15.3% compound return over the course of five decades in his fund.
Ed Lampert
After Lampert graduated from Yale in 1984 he started at Goldman Sachs. With $28 million in seed money he founded ESL Investments in 1988. Lampert's investment style can best be described as ‘concentrated value’, often focusing on the retail sector. He typically holds his investments for several years and usually has between three and fifteen stocks in his portfolio. Since starting ESL Investments he has racked up returns averaging 29% a year.
Todd Combs
Todd graduated in 1993 from Florida State University and completed a course at Columbia Business School in 2002. In 2005 he started Castle Point Capital and achieved a reported compound annual return between 2005 and 2010 of 34%. In 2010 Warren Buffett tapped Combs to (possibly) eventually replace him as chief investment officer at Berkshire Hathaway.
Michelangelo dedicated four years of his life to creating the ceiling frescos in the Sistine Chapel in the Vatican. One cannot help but be both amazed and inspired by the craftsmanship of this renaissance master. Michelangelo is said to have had a sharp, critical temperament and so committed to his craft that he has been held to be one of the greatest artists of all time. Warren Buffett was once asked to describe Benjamin Graham, the father of Value Investing, and he summarized him this way: “When proper temperament joins with proper intellectual framework, then you get rational behaviour.” With both Graham and Michelangelo, two masters in their own respects, one sees that a proper temperament combined with patience and dedication leads to rational behavior and ultimately success.
Rationality allows value investors to look at market fluctuations as a friend rather than an enemy. Instead of being hyped up by market fear or greed, the value investor aim to profit from this folly rather than to participate in it. Rationality also require that value investors see shares as small pieces of a business and therefore value shares based on the underlying value of the business. These principals were established by Graham in 1934 and as principals are as relevant today as they were then.
Current global and local market fluctuations, fueled by events like the prolonged Euro zone debt crises and the slowdown in Chinese economic growth, create fear in financial markets. This in turn drives down the share prices of many great companies, which creates buying opportunities for the rational investor. Keeping Graham’s above principals in mind, value investors recognize that these conditions are currently creating good buying opportunities in certain sectors of the South African market.
Cyclical businesses like those in the commodities sector are currently very attractive and offer great value at great prices, while businesses in other sectors like industrials, pharmaceuticals and retail are generally more expensive, and thus less attractive, than commodities. Although these sectors will continue delivering value in future, it is likely to be at much slower rates than commodities will. In order to create wealth value investors will always strive to limit losses and maximize compounded annual returns over long periods. Current conditions in the commodities market sector point to such wealth creation opportunities.
Determining good buying opportunities in the commodities sector requires valuing the underlying businesses in the sector. Typically a valuation includes determining whether an investment candidate has good management in place, possesses a durable competitive advantage, has attractive economics, and whether the price per share is close to (or preferably below) the intrinsic value per share of the business.
There are a number of businesses in the commodities sector that have excellent management in place, for instance, Anglo American Plc., Assore Ltd, BHP Billiton Plc., and Kumba Iron Ore Ltd. These companies also all possess some kind of a durable competitive advantage.
There are many ways to consider the sources of competitive advantage. I typically classify a durable competitive advantage as stemming from a supply advantage, a demand advantage, or a combination of both. A supply advantage is typically created by patents, licenses, access to limited resources, specialized know-how, or economies of scale. A demand advantage is typically created by product popularity, strong brand loyalty, high switching costs, market presence, comprehensiveness of products, a market niche, etc. This classification, applied to BHP Billiton, illustrates that its diversified portfolio of low cost, high quality assets leads to a competitive advantage based both on supply advantages (relatively low cost and access to limited resources) and a demand advantage (high quality resources). Next consider the economics of each of the companies being investigated.
There are many elements to consider when reviewing a company’s economics. A detailed valuation includes reviewing a business’ annual reports, including full financials and notes, as well as calculations to determine various ratios and intrinsic valuations. In addition to this I strongly focus on the stability, growth, and sustainability of the business over time. I admit that performing detailed valuations can feel as demanding as painting the Sistine Chapel’s frescos. However, a review of readily available indicators like the price to book value ratio, the price to earnings ratio, and the earnings yield will quickly highlight favourable candidates to be investigated in more detail. In the commodities sector there are currently businesses trading with price to book value ratios close to or below 1.0, price to earnings ratios as low as 7.8, and earnings yields higher than 10%. These indicators point to great value at great prices, exactly the kinds of businesses a value investor is looking for.
In conclusion, a benefit of market fluctuations is that there are generally always great companies on offer to value investors. Currently certain companies in the commodities sector aren’t just offering great value they’re offering it at great prices, like BHP Billiton. Therefore, the investor willing to approach the market like the rational, tempered master who is willing to patiently and diligently value businesses, ignore market emotions and short term market fluctuations, and willing to remain invested in these companies for at least 5 to 10 years is likely to see above average market returns from these investments. I believe that this rational approach to investing, i.e. diligently searching for and grasping opportunities, will lead to wealth creation success, your own beautiful fresco.
Please note, this is a screening valuation only. This is not a full fledged valuation of the subject shares and therefore should not be used as the final basis for any investment decision.
Prior to performing a detailed valuation on a business, as illustrated in the many examples below, I perform a ‘screening valuation’ of various businesses in order to determine where I should direct my detailed analysis effort. In order to screen businesses I focus on the following elements or numbers of the considered businesses: • 10 years of Earnings per Share (EPS) data • 10 years of deflated EPS data • 10 years of ROE data • analyst or consensus forecasted EPS growth rate, if available • lowest P/E ratio over the last 5 to 10 years • the average Retention Rate (RR) of the business • the latest available Book Value per Share (BPS)
Using this set of data for each business considered I calculate a number of ratios and returns for each to help me identify potential value investment candidate businesses. Businesses that pass this initial screen will further be analyzed in detail. From the detailed (individual) analyses investment decisions will be made, i.e. the decision as to where investment capital will be allocated.
In this post I will be comparing 18 different value stocks as of 28 May 2012. The table below shows the final result of the analysis (I have excluded Mondi and Reinet's screens due to incompleteness of my analysis or incompleteness in the data available).
This table shows the result of my screening calculations (not shown in this post) and include 8 overall calculations. Below I have described some of them. They are:
Relative to Bond Yield - I calculate the earnings for a share based on the latest earnings per share (EPS) and current share price (i.e. E/P). I then calculate the historical EPS growth rate and, combined with the analyst expected forecasted EPS, estimate the relative EPS for the next 10 years and possible relative share price in 10 years, if I invested R100 in this business today. I then compare this to the return of R100 invested in a 10 year South African government bond
Stability Score - I calculate the stability in growth of both the historical EPS and historical Deflated EPS. The stability of growth of Earnings-, Sales- and Book Value per Share are vitally important for any value investor.
Expected EPS Growth - the expected EPS growth is based on the historical growth rate and the analyst estimate. The expected EPS growth is very conservative to ensure that we rather under-promise and over-deliver than the alternative.
Expected Return - the compounded annual rate of return is estimated using two different techniques. The first considers the EPS growth over the next 10 years and the second considers the growth in book value over the next 10 years. Both estimate the future share price from these numbers, includes the possible dividends over the next 10 years, and then calculates the expected compound annual return. As can be expected these approaches produce different results, and the final expected return is the average of the two results.
Stability Return Score - we now come to the crux of the matter. I take the stability score and multiply it with the expected return. This gives me a stability return score, i.e. the expected return impaired for the stability (or instability) of the earnings history. The stability return score forms the basis of the decision whether to further investigate, i.e. perform a detailed analysis of, the business.
Total Overall Score - I use the stability return score, multiplied by the relative bond score, to calculate the combined effect of the expected return and relative performance to a R100 10 year South African government bond.
The relative ratios and numbers calculated above allow me to screen various possible investments in order to identify the best possible investment candidates. There are a number of other screens not shown here, e.g. price-to-earnings ratio's, price-to-book ratio's, Return on Invested Capital, management screens, competitive advantage screens, etc.
My recommendations
I hope you have enjoyed this short valuation example. Based on the above I further analysed (in detail) BHP Billiton. Finally, after the detailed analysis of BHP and other current investment shares, I made my investment recommendations for Richland IH and we will allocate investment capital based on these decisions.
A word of warning to anyone contemplating investing in mining shares/commodities: this is a very specialized field and a tenet of any value investor is to remain within his or her circle of competence. Resources are very attractive to value (i.e. long-term) investors, i.e. the world population is growing and although growth in economies speed up and slow down the demand for commodities will just increase in years to come, who are willing to invest in companies with diversified and extensive resource basis (i.e. ore bodies in the ground), that have good management in place, have good distribution networks in place (especially in emerging and high growth markets), are willing to remain invested for the long-term, and fully understand the risks of holding commodity shares (i.e. if they have to sell during a commodity down cycle they will be punished for the decision - commodity companies are price takers not price makers).
Please feel free to contact me in case you have any additional questions or suggestions regarding this, or any other, valuation. Always remember to live every day to be a 105%'er ;)
Be Extraordinary! Myles Rennie
P.S. The above analysis should not be considered investment advice. I will not be held liable for any investment decisions, or investments, made based on my analysis.
This is a short post to share some of the books I have studied on value investing and valuation. There is a wealth of information and knowledge locked up in these books. I will start with some of the classics, but the list also includes more modern approaches to value investing.
My reading list (I read and re-read most of these books all the time):
Security Analysis – Benjamin Graham and David Dodd
The Intelligent Investor – Benjamin Graham
The Interpretation of Financial Statements - Benjamin Graham
Common Stocks and Uncommon Profits – Philip Fisher
Conservative Investors Sleep Well - Phillip Fisher
The Theory of Investment Value – John Burr Williams
The Snowball: Warren Buffett and the Business of Life – Alice Schroeder
Berkshire Hathaway Annual Reports
The Essays of Warren Buffett: Lessons for Corporate America
The Warren Buffett Way – Robert Hagstrom
The Warren Buffett Portfolio - Robert Hagstrom
One Up on Wall Street – Peter Lynch
The New Buffettology – Mary Buffett and David Clark
The Warren Buffett Stock Portfolio - Mary Buffett and David Clark
How to Pick Stocks Like Warren Buffett - Timothy Vick
Wall Street on Sale - Timothy Vick
The Triumph of Value Investing – Janet Lowe
Value Investing: From Graham to Buffett and Beyond – Bruce Greenwald
Competition Demystified - Bruce Greenwald
Applied Value Investing – Joseph Calandro
New Era Value Investing – Nancy Tengler
The Conscious Investor: Profiting from the Timeless Value Approach – John Price
Damodaran on Valuation – Aswath Demodaran
Investment Valuation: Tools and Techniques for Determining the Value of Any Asset – Aswath Demodaran
The Dark Side of Valuation: Valuing Young, Distressed, and Complex Businesses - Aswath Demodaran
The Little Book of Valuation - Aswath Demodaran
Come into my Trading Room - Dr Alexander Elder
The Guru Investor - John Reese, Jack Forehand
Valuation: Measuring and Managing the Value of Companies - McKinsey
Bejamin Graham and the Power of Growth Stocks - Frederick Martin, Nick Hansen, et al.
Modeling Structured Finance - Keith Allman
Corporate Valuation Modeling - Keith Allman
The Little Book of Value Investing - Christopher Browne
I believe you will enjoy these books as much as I have. Buy them, read them and treasure them. These books are invaluable.
Value investors are market 'pricers', not market 'timers'. However, understanding major economic cycles and the effects those cycles have on bond and stock prices are important to the enterprising value investor. In order to outperform your peers as an investor you will have to have a good understanding of how these variables all interact with one another.
Inflation can be considered an invisible 'tax' that leads to a loss of purchasing power, i.e. inflation is an upward movement in the average level of prices. Warren Buffett calls inflation a far more devastating 'tax' than anything that has been enacted by legislation. For a very simplistic understanding of inflation let's consider the following example. Imagine that:
you have savings of R100 today which you don't invest in a secure but high yielding investment (the kind of investments we make at Richland IH)
a can of Coca-Cola costs R10 today
the average annual inflation rate in the country is 100% (the actual South African inflation rate is close to 6% per annum, but we will use 100% for the sake of the example)
as a result of inflation that same can of Coca-Cola will cost R20 (i.e. R10 * 100% + R10 = R20)
therefore, if you can currently buy 10 cans of Coca-Cola with your R100 (i.e. R100 / R10 = 10) you will be able to buy only 5 cans of Coca-Cola with your R100 in a years time due to inflation (i.e. R100 / R20 = 5)
This example is a little extreme but it illustrates the point, inflation leads to increasing prices resulting in a reduction of our purchasing power. There are many causes of inflation, but the major ones are: cost-push forces (when input costs increase, e.g. import prices rise, wage increases, etc.), demand-pull forces (when demand is greater than supply of a product or service), exchange rates, and finally monetary inflation (the increase in the money supply of the country). The causes are not too important in this article, rather the effect on bond yields and stock prices.
Governments would like inflation to be under control, i.e. not too high and not too low. Both these situations are bad for economic growth and poor economic conditions (or growth) which leads to instability, tough times for a country's citizens, and it makes it hard for a political party to remain in power. Governments mainly use one of two methods to control inflation: either fiscal policy (related to government spending and taxes) or monetary policy (the supply of money in the economy). Governments rely heavily on monetary policy to control inflation. Monetary policy is the process by which the monetary authority of a country (i.e. the government) controls the supply of money, often targeting a rate of interest for the purpose of promoting economic growth and stability. To stimulate a country's economy the monetary authority will lower interest rates in the hope that easy credit will entice businesses into expanding. Conversely, increasing interest rates is intended to slow inflation in hopes of avoiding distortions and deterioration of asset values.
This brings me to the crux of the discussion, i.e. rising and lowering inflation rates and the value investor. The bottom line is that rising and lowering inflation rates has a direct effect on bond yields and stock prices. Understanding this sacrosanct, correlative relationship is important to the value investor and should never be ignored. In short, rising inflation rates cause bond yields to rise and P/E ratios of shares to decline. Therefore, over longer periods stock and bond prices tend to react similarly to the same economic information. The next section will explain this relationship using examples with bonds, coupons, dividends, etc. to show the reaction of bonds and stocks to inflation.
The relationship between Inflation and Bonds
Before I start explaining the relationship between inflation and bonds, I need to specify some information regarding bonds (for those that don't know anything about bonds). Each bond has an expected return and as investors we are interested in understanding how much it is. Yield is the measure used most frequently to estimate or determine a bond's expected return. Yield is also used as a relative value measure between bonds. There are two primary yield measures that must be understood to understand how different bond market pricing conventions work: yield to maturity and current yield.
A yield-to-maturity calculation is made by determining the interest rate (discount rate) that will make the sum of a bond's cash flows, plus accrued interest, equal to the current price of the bond. Current yield is the anticipated return on an investment, expressed as an annual percentage. It is the coupon value / price of the bond. Whichever way you calculate yield, the relationship between price and yield remains constant: The higher the price you pay for a bond, the lower the yield, and vice versa. Here, we will use yield as the yield-to-maturity when referring to a bond yield. To illustrate yield-to-maturity I have created a little example.
Imagine a bond with a face value of R1000 currently selling for R950 in the market. It pays a coupon of 8.5% per year (roughly the same as the current South African Risk Free Rate of return - a return determined primarily by the inflation rate and expected economic growth rate of South Africa), which we assume to be the current prime interest rate in South Africa. The 8.5% coupon rate will ensure an annual coupon of R85. In my example the bond will mature in two years, i.e. return the principal of R1000 to the holder of the bond.
Face Value
R1,000.00
Current Price
R950.00
Coupon Rate
8.50%
Discount Rate
11.40%
Year
1
2
Coupon Values
R85.00
R85.00
Principal Value
R1,000.00
Total Return
R85.00
R1,085.00
Discount Factor
0.90
0.81
Discounted Value
R76.30
R874.30
Total Value
R950.60
In order to calculate the yield-to-maturity (or yield) of my example bond, I performed a little Discounted Cash Flow (DCF) analysis. From the example you will see that if I bought this bond today for R950 I will receive two coupons plus R1000 back in two years. This implies a yield-to-maturity of 11.40%, not bad! The important aspects to recognize here are that current price, coupon rate, and face value all influence the yield-to-maturity rate.
The question is what happens when the interest rate of 8.5% goes to 10%? Let's imagine the bond above was issued two months ago at R1000 par value and now (two months hence) the interest rate changed to 10%. Bonds currently being issued will pay a coupon rate of 10%, instead of the 8.5% of two months ago, and thus have a yield to maturity of 10%. This implies that someone buying and holding this bond will pay R1000, and receive two coupon payments of R100 each as well as the original R1000 in two years. And what happens to the bonds issued two months ago at 8.5%? Their prices have to be revalued down in order to make them more or equally as attractive as the current bonds! To understand this, look at the DCF below and consider that we now have to discount the coupons and principal at 10% (the current interest rate) instead of 8.5%. Using 10% (my new yield-to-maturity) instead of 8.5% (coupon rate at time of issue) results in a higher discount factor and therefore reduces the current value of the bond. In summary, you can consider it like this: if current bonds give a better return that existing bonds then existing bonds are less attractive and have to sell at a discount
From this explanation it is clear that in the first example above, with the par value (R1000) > current bond price (R950), that the interest rate was less than 8.5% at the time the bond was issued. Therefore, the value of the bond decreased to R973.97 and the yield of the bond increased to 10% when interest rates increased.
Interest Rate at 10%
Face Value
R1,000.00
Current Price
R973.97
Coupon Rate
8.50%
Discount Rate
10.00%
Year
1
2
Coupon Values
R85.00
R85.00
Principal Value
R1,000.00
Total Return
R85.00
R1,085.00
Discount Factor
0.91
0.83
Discounted Value
R77.27
R896.69
Total Value
R973.97
Interest Rate at 7.00%
Face Value
R1,000.00
Current Price
R1,027.12
Coupon Rate
8.50%
Discount Rate
7.00%
Year
1
2
Coupon Values
R85.00
R85.00
Principal Value
R1,000.00
Total Return
R85.00
R1,085.00
Discount Factor
0.93
0.87
Discounted Value
R79.44
R947.68
Total Value
R1,027.12
Conversely, if interest rates fell from 8.5% (the original coupon rate) to 7% (the new yield-to-maturity) the value of existing bonds would increase to R1027.12 based on the same logic as above, i.e. current bonds would give a poorer return that existing bonds and therefore make existing bonds more attractive, but the yield of the bond would decrease (it has decreased to 7%). To illustrate the relationship see the pictures below.
In case the the pictures are not 100% clear, I summarized the relationship in the little table below:
Inflation
Interest Rates
Bond Prices
Bond Yields
Rise
Rise
Lower
Rise
Lower
Lower
Rise
Lower
This therefore establishes the relationship as follows: rising inflation leads to increased interest rates, which lowers bond prices but increases bond yields, and vice versa. OK, keeping this relationship in mind, and noticing that a higher bond price leads to a lower yield (and vice versa) allows us to now consider interest rates and share prices in general.
The relationship betweenInflation and Shares
I start by remind you that shares have a yield as well, it's the annual earnings per share divided by the price per share (or E/P). You will be familiar with P/E (or the Price-to-Earnings) ratio that I often write about here. Therefore, a shares yield is the inverse of it's P/E ratio. Let's consider this for a minute. When a share has a P/E ratio of 10 it has an earnings yield of 1 / 10 = 10%. A P/E ratio of 15 is an earnings yield of 1 / 15 = 6.7% and finally a P/E of 5 is an earnings yield of 20%. Therefore, as value investors we are interested in shares with low P/E ratio's which have high earnings yield.
We don't often think of shares as bonds, but they are actually, albeit bonds with 'less than guaranteed' coupons. The shares we buy all have annual earnings per share, or essentially an annual 'coupon'. Whatever profits the company generates each year are legally owed to its shareholders. This is where the relation between shares and bonds lie. The major difference is that a bond's coupon and face value are (almost) guaranteed by the issuer and therefore reduces the risk of the investor (the major risk remaining is credit/default risk of the issuer of the bond). In the case of a share there are no such guarantees.
In most cases a company retains all or part of its profits and reinvests them to generate, I hope, higher earnings in future (thereby compounding your investment). Therefore, just like a bond investor, our goal should be to choose investments whose yearly returns, or coupons, are stable, secure, more than compensate for inflation, and beats bond yields (to compensate for holding an instrument whose coupon is not assured)!
Let's take this thinking back to our example. We assumed that our current Risk Free Rate was 8.5% and therefore a firm earning R1.00 profit per share needs to trade (i.e. have a price of) for R11.76 (R1.00 / 8.5% = R11.76) to yield the same 8.5% (P/E = R11.76 / R1.00 = 11.76 and therefore has an earnings yield of 1 / 11.76 = 8.5%). Next we assume (correctly I believe) that the firm possesses more risk than a bond and therefore the shares of the firm will be priced at lower than R11.76 per share, which in turn leads to a higher earnings yield. At a price of R10, the R1.00 earnings would represent a 10% yield. Due to the fact that investors always have a choice between investing in bonds or shares (or other investment classes), share prices and yields will (in general) follow bond yields. This then brings me to the conclusion of my post and illustrated in the table below:
Inflation
Interest Rates
Bond Prices
Bond Yields
Share Prices
Earnings Yield
Rise
Rise
Lower
Rise
Lower
Rise
Lower
Lower
Rise
Lower
Rise
Lower
I can summarize all these relationships illustrated as follows:
when inflation and interest rates rise both bond and share prices fall (and their yields rise)
when inflation and interest rates fall both bond and share prices rise (and their yields fall)
Keeping this little table handy allows the long-term, value orientated investor to keep pace of inflation and interest rate cycles in order to prepare for both selling and buying opportunities in the market.
With the above knowledge in mind you could be asking: why buy shares, considering the additional risk, rather than bonds? The answer is simple: if you select the right shares they will have the ability to outperform bonds over the long term. Warren Buffett says a share should be thought of as a bond substitute, a dynamic security that has the capability of providing you will less or more income each year than it did the preceding year. However, when picking a share to invest in make sure that you find a firm:
whose returns beat inflation
whose returns beat the risk free rate
whose current earnings yield (i.e. inverse of its P/E ratio) is near or above yields on long-term bonds
which might currently have an earnings yield lower than long-term bond yields, but is growing and is expected to generate an earnings yield that would soon surpass bond yields
that you can buy at the cheapest possible price because that's the best way of ensuring that you can beat bond yields by a wide margin
This is not to say that a value investor never considers investing in bonds. Bonds are more attractive than shares when the yields of bonds far surpass the average earnings yield of shares. This happens regularly because bonds and share yields are not in sync. There are many market forces driving them that cause these yields to fluctuate relative to each other, e.g. inflation (as discussed above), market or firm-specific news (like a management crises), etc. The enterprising value investor will always consider both bond and share investments before allocating her capital wisely.
I hope you have enjoyed this post. Contact me if you have any additional questions regarding this subject.
Please note, this is a screening valuation only. This is not a full fledged valuation of the subject shares and therefore should not be used as the final basis for any investment decision.
Prior to performing a detailed valuation on a business, as illustrated in the Truworths or Bowler Metcalf examples below, I perform a ‘screening valuation’ of various businesses in order to determine where I should direct my detailed analysis effort. In order to screen businesses I focus on the following elements or numbers of the considered businesses: • 10 years of Earnings per Share (EPS) data • 10 years of deflated EPS data • 10 years of ROE data • analyst or consensus forecasted EPS growth rate, if available • lowest P/E ratio over the last 5 to 10 years • the average Retention Rate (RR) of the business • the latest available Book Value per Share (BPS)
Using this set of data for each business considered I calculate a number of ratios and returns for each to help me identify potential value investment candidate businesses. Businesses that pass this initial screen will further be analyzed in detail. From the detailed (individual) analyses investment decisions will be made, i.e. the decision as to where investment capital will be allocated.
In this post I will be comparing 9 different value stocks as of 8 May 2012. The table below shows the final result of the analysis.
This table shows the result of my screening calculations (not shown in this post) and include 8 overall calculations. Below I have described some of them. They are:
Relative to Bond - I calculate the earnings for a share based on the latest earnings per share (EPS) and current share price (i.e. E/P). I then calculate the historical EPS growth rate and, combined with the analyst expected forecasted EPS, estimate the relative EPS for the next 10 years and possible relative share price in 10 years, if I invested R100 in this business today. I then compare this to the return of R100 invested in a 10 year South African government bond
Stability - I calculate the stability in growth of both the historical EPS and historical Deflated EPS. The stability of growth of Earnings-, Sales- and Book Value per Share are vitally important for any value investor.
Expected EPS Growth - the expected EPS growth is based on the historical growth rate and the analyst estimate. The expected EPS growth is very conservative to ensure that we rather under-promise and over-deliver than the alternative.
Expected Return - the compounded annual rate of return is estimated using two different techniques. The first considers the EPS growth over the next 10 years and the second considers the growth in book value over the next 10 years. Both estimate the future share price from these numbers, includes the possible dividends over the next 10 years, and then calculates the expected compound annual return. As can be expected these approaches produce different results, and the final expected return is the average of the two results.
Stability Return Score - we now come to the crux of the matter. I take the stability score and multiply it with the expected return. This gives me a stability return score, i.e. the expected return impaired for the stability (or instability) of the earnings history. The stability return score forms the basis of the decision whether to further investigate, i.e. perform a detailed analysis of, the business.
Total Overall Score - I use the stability return score, multiplied by the relative bond score, to calculate the combined effect of the expected return and relative performance to a R100 10 year South African government bond.
The relative ratios and numbers calculated above allow me to screen various possible investments in order to identify the best possible investment candidates. There are a number of other screens not shown here, e.g. price-to-earnings ratio's, price-to-book ratio's, etc.
My recommendations
I hope you have enjoyed this short valuation example. Based on the above I further analysed (in detail) Bowler Metcalf, Discovery Holdings and Assore. Finally, after the detailed analysis of each, I made my investment recommendations for Richland IH and we allocated investment capital based on those decisions.
Please feel free to contact me in case you have any additional questions or suggestions regarding this, or any other, valuation.
Be extraordinary! Myles Rennie
P.S. The above analysis should not be considered investment advice. I will not be held liable for any investment decisions, or investments, made based on my analysis.
This is another valuation done for Richland IH. We have been considering Truworths as an investment opportunity with some other great South African companies. Truworths is, as this post will show, a great company with some pretty amazing business economics, but it is expensive. Read the post to see what I would recommend for all long-term/patient value investors regarding Truworths.
Our goal at Richland IH is to create sustainable wealth, over the long-term, by following the principles laid down by some of (what I classify to be) the most successful investors of all time. Our investment analysis approach always rests on thorough analysis of the underlying security in order to ensure safety of principal and an adequate return. There are always four major criteria that any investment has to comply with:
It should be a simple business to understand within my circle of competence
It should have good management in place
It should have a sustainable or durable competitive advantage
It should have favourable economics
In the valuations I post here I focus on the last two criteria and demonstrate below how I consider these. Without further delay, let's delve into Truworths (ticker symbol: TRU).
Phase I: is this a company I want to invest in?
In order to determine whether I will invest in this business (please note that I do not refer to a stock as a stock but rather as a business and therefore all valuations are based on logic and sound business principles more than anything else) I would first like to focus on what I call my SGS criteria, i.e. Stability, Growth, and Sustainability of the business.
Stability and Growth of Earnings per Share (EPS) and Sales per Share (SPS) of Truworths
My first criteria in valuing a business is always stability and growth. I am looking for stable businesses growing at an acceptable rate. Stability through a cycle (i.e. through market cycles) demonstrates that the firm can weather storms, pass on price increases to customers, and have management in place that can steer the firm clear of serious fluctuations and danger.
I measure stability and growth of both EPS and SPS over the past 10 years. 10 years represents one or more market peaks and troughs which allows me to track through-the-cycle stability and growth. I measure these numbers based on year to year EPS and SPS. Stability is expressed as a percentage in the range 0 to 100 percent. A high stability percentage corresponds to high stability and a low stability percentage corresponds to low stability. Stability of 100 percent signifies complete stability, meaning that the data is changing by exactly the same percentage year-on-year. I have developed a number of Microsoft Excel functions to perform these calculations for me. These functions are intelligent enough to remove outliers, weigh more recent data as more important, etc.
TRU's Earnings per Share stability is 91.6% which is a very high level of stability. Consider the fact that we just survived the second biggest world-wide recession of recorded times and that TRUs EPS does not even show it, and you can't help but be amazed. What is even more amazing is that TRUs Sales per Share (SPS) is stable at 93.6%. This is almost perfectly stable.
Next we consider what effect inflation had on TRUs EPS and SPS. From the table it is clear that inflation over the last 10 years impacted TRUs EPS stability slightly negatively whereas it shows that TRUs SPS displays even more stable. The reason I look at deflated (or real) EPS and SPS is to see how sensitive the stability score is to inflationary pressure. The astute investor needs to understand and be satisfied with the firms stability in real and nominal terms.
From these tables I conclude that I am satisfied with both the nominal and real stability scores of TRU and therefore it is a pass for this criteria. This is the first indicator of a business with a durable competitive advantage.
Next I start considering the compound annual growth rate of EPS and SPS over the past 10 years. As per the stability criteria above, I will consider firm EPS and SPS growth on a real and nominal basis. Inflation, especially in South Africa with relatively high inflation, can lead to 'high' or 'attractive' nominal growth numbers and it is good practice to understand the real growth (note that the Earnings growth rate used when performing a Equity Valuation Discounted Cash Flow (DCF), calculated as the product of the Retention Rate and Return on Equity, is very close to the real EPS growth rate calculated in the table above - thus, the real EPS growth rate is an important number in valuations).
I developed Microsoft Excel functions to calculate the historical growth rate. These functions do not simply calculate the average or compound growth rate of the 8 years, they consider the annual growth rate year on year. TRUs deflated EPS grew by 18.65% year on year wheres its SPS grew lower at 12.33% per year. These are fantastic growth rates considering that the effect of inflation has already been removed. EPS growing at 18.65% compounded annually should take between 4 and 5 years to double, and that sound very attractive indeed. These amazing growth rates (both EPS and SPS) is the second indicator that TRU has a durable competitive advantage. The figures below show respectively EPS vs. EPS Growth, and SPS vs. SPS Growth for TRU.
I love these two graphs above. Notice that both EPS and SPS growth never slumps below (plus/minus) 10% year-on-year. These graphs point to a business with great economics. I also like the way that both the EPS and SPS growth curves are starting to 'pull-up' and to the right as TRU recovers from the recession. TRU also pass the growth criteria.
I am looking for businesses that have stability percentages of 80 percent or more for both their earnings and their sales. If a company does not satisfy this criterion, I usually just pass it by. After all, if there was little stability in sales and earnings in the past, then it becomes virtually impossible to make confident forecasts for the future.
Return on Equity (ROE) and Return on Invested Capital (ROIC) of Truworths
I like companies with an above average Return on Equity (ROE) of at least 18% or better, as this is another indicator that the company has a durable competitive advantage. Because some companies can be financed with debt that is many times their equity, they can show a consistently high ROE, yet still be in unattractive price competitive businesses. To screen out these companies I consider a firms Return on Invested Capital (ROIC) in conjunction with its ROE. A firms ROIC must be higher than 15% and its ROIC must be higher than its Weighted Average Cost of Capital (WACC), else it will fail my screening.
Keep in mind that if a company can maintain its ROIC consistently above its WACC it is creating value for its shareholders. A company that has a ROIC lower than its WACC, irrespective of the rate of growth of the company, is destroying value. In fact, when ROIC is smaller than WACC, then the faster the company grows the faster it is destroying value!
Calculating the WACC of a business can be a complex task. There are many different ways of calculating the Cost of Equity and the Cost of Debt of a business. The calculations for TRUs Cost of Equity, Cost of Debt, and WACC is not displayed here, but if required please email me (see my contact form) and I will gladly supply the calculations (and the thinking). In short, I calculated TRUs WACC as follows:
I took an extremely conservative approach to TRUs year-on-year Cost of Equity. I estimated a BETA of 0.35, a risk free rate of 8.5% and a Equity Premium of 7%. This yielded a Cost of Equity (using CAPM) of 11%
I used a synthetic bond rating approach to calculate TRU's year-on-year Cost of Debt
From the graph above it is clear the TRU has a fantastic ROE at an average 40%. Its ROIC is even better at an average of more than 50%. This implies that for every RAND of debt or equity provided to Truworths it generates about R 0.50 (or 50 cents) return per annum. This is truly amazing! TRUs average ROE is much higher than the required 18% and the average ROIC is also much higher than the required 15%. Furthermore, the ROIC is much higher than the average WACC of 10.9%. Therefore, management is creating value for shareholders at a fantastic pace.
The consistently high ROE and ROIC rates is the third indicator that TRU has a durable competitive advantage.
TRU pass this criteria.
Corporate Stability of Truworths
I like companies that demonstrate a high level of corporate stability over the long term. The functions I have developed in Microsoft Excel to measure corporate stability consider a number of different financial ratio's of a firm to determine a stability score. A high corporate stability score is required before considering any investment in the company.
A score above 8.15 indicates little chance of the business failing based on current management principles. The average stability score for TRU over the last five years has been 16.25 which is much higher than the required 8.15 for a very stable company.
This is the kind of company I like to invest in, because it has a good chance of still doing what it is doing, and being in business, 10 years from now. TRU is the kind of business I can invest in and forget about, come back in ten years, and it is very likely to still be going strong.
The consistently stability score is the third indicator that TRU has a durable competitive advantage.
TRU pass this criteria.
Capital expenditure of Truworths
I like companies that do not have major capital expenditures, i.e. I look for companies that do not need to spend a lot of money on major upgrades of plant and equipment or on research and development to stay competitive.
TRUs free cash flow per share over the past four years are all positive, indicating that the company is generating more cash that it is consuming. Its average FCFE per Share for the last four years was R 2.90. It showed positive Reinvestment Rates over the last four years with an average of 26.6%. This shows that TRU is investing in the future (i.e. investing in its growth assets).
These are both favorable signs, and so the company passes this criteria.
TRU pass this criteria.
Debt position of Truworths
I like businesses that are conservatively financed. Nonetheless, I am willing to invest in firm with solid bond ratings. In South Africa it is not always easy to obtain a bond rating for a firm, and therefore I have developed functions that calculate a synthetic bond rating based on the fundamentals of the business. TRUs synthetic bond rating is calculated as "AAA" based on both its corporate stability rating and the fact that its interest cover ratio is very, very high. In fact, TRU shows no of debt currently on its balance sheet (2011) which is considered exceptional. TRU has very strong earnings and will be able to repay a substantial amount of debt based on it.
TRU pass this criteria.
Use of Retained Earnings by Truworths
This is one of Buffett's main screening criteria, and I love it was well. Buffett likes to see if management has spent retained earnings in a way that benefits shareholders. To determine this, Buffett takes the total amount of retained earnings over the previous 10 years of 1147.11 cents per share and compares it to the gain in EPS over the same period of 390.50 cents. TRUs management has proven it can earn shareholders a 34.2% return on the earnings they kept. This is a fantastic number and one can say that management is doing a great job of putting the retained earnings to work.
TRU pass this criteria.
This concludes the quantitative elements of the Phase I valuation. Next the valuation moves to Phase II.
Phase II: should I buy based on the economics?
If and when I get positive responses to all the above criteria, I then proceed with a value vs. price analysis. The value analysis will determine whether or not the stock of the business should be bought. The following is how I evaluate TRU quantitatively.
I start by understanding the intrinsic value of the business from the perspective of the Balance Sheet, then the Income Statement, and finally I look at the growth value of the business, i.e. Discounted Cash Flow based on Free Cash Flows.
Intrinsic Valuations
I have decided not to show the BS and IS valuations in this post. Instead I will show the two DCF valuations, i.e. Free Cash Flow to Equity holders (FCFE) and Free Cash flow to the Firm (FCFF) respectively. The FCF valuations value the operating assets in the business, both existing and growth assets. I use the FCF valuations to determine the upper end of intrinsic value (i.e. the more optimistic possible intrinsic values).
Here I performed both FCFE and FCFF valuations, but in both cases calculate the intrinsic equity value of the business, that which a shareholder would be interested in. Enterprise value, as a matter of interest, would be the value that someone buying the entire business would be interested in. Below is the three-stage FCFE calculation.
You are more than welcome to contact me if you would like information as to any of these calculations. Below is a two-stage FCFF calculation. I calculated the FCFE and FCFF using different stage models just to see the difference in valuation.
You will notice there is a difference between the two valuations. They should be close together, but there are good fundamental reasons why they could differ. The most relevant is that I don't calculate the FCFF and FCFE from a forecasted Income Statement or Balance Sheet. Rather, I calculate fundamental growth rates for Net Income and Operating Earnings respectively and these rates are based on the average Equity Reinvestment Rate, ROE, Operating Reinvestment Rate, and ROIC of the last five years. Therefore, they will result in differences. Note also that this is a risk for valuation, these slight input variable differences cause large valuation differences.
In the rest of the valuation I use the average of the two values to estimate a more realistic intrinsic DCF value.
Intrinsic Value - putting it all together
From the exercise above I obtained a number of different intrinsic values for BCF. I usually also do two Graham Valuations as described in Chapter 39 of his 1962 Security Analysis. The value (which is based on earnings) is calculated for TRU using Graham's approach and is shown as G#1 and G#2 in the graph below. Note that BS shows the Replacement Asset intrinsic value. IS shows the Earnings Power Value. DCF show the average DCF values form the perspective of both FCFE and FCFF analysis.
The graph shows the current share price (roughly R 83.00 per share at the time of writing) as the dark blue line at the top of the graph. First you will notice that all intrinsic valuations are less that the current share price - therefore the share can be considered expensive and as having no margin of safety.
You will furthermore note in this graph that both the BS (Balance Sheet Book Value) and RNAV (Replacement Net Asset Value) values are less than the EPV (Earnings Power Value from the Income Statement) value. Also, both the BS and RNAV values are less than the two Graham values (i.e. G#1 and G#2). This is the final indicator that TRU enjoys a durable competitive advantage.
Now notice that EPV , G#1 and G#2 are all less that the valuation considering growth, i.e. DCF (which in this case is the average FCFE and FCFF valuations). The bars in this chart show a classic example of a company with a durable competitive advantage and with considerable growth assets to consider in the valuation. This graph only shows the valuations for 2011, but in my analysis the gaps are consistently positive positive for the last five years.
Based on the analysis above a fair price to pay for TRU (at the end of June 2011) would be somewhere near R 45.00 per share. Paying more than that would imply paying for potential growth, not something a value investor likes to do. Most value investors, like myself, like to buy assets at a discount (which gives a margin of safety). Therefore, a value investors buy price would be 75% of the fair value: R 33.75 = R 45.00 x 75%.
In order to make the final investment decision I have to consider what my potential return on investment (ROI) could be if I bought at the various values presented in the graph above.
Based on the valuations above what is the expected return in 10 years?
The final step in the valuation is to determine what the expected total return (i.e. share price and cumulative dividend's over the next 10 years) value could be in 10 years time given the current book value, earnings per share (EPS), payout ratio, P/E ratio, EPS growth rate, Equity Reinvestment Rate, ROE, Net Income Growth rate. I perform two calculations to determine the possible future share price.
The first method starts from the perspective of the latest EPS and the second method starts from the current book value. Both values work on a similar basis, i.e. project possible EPS in 10 years time, multiply this number by a VERY conservative P/E ratio (based on the minimum P/E over the last 10 years) to get the possible share price in 10 years, and add the expected dividend to be received over the next 10 years to get to total returns expected (IF you leave your dividend in the return - something all value investors ascribe to). The result is the table below showing the two methods. All the details of the EPS growth rates, Net Income growth rates, etc. (all determined from fundamental growth formulas) are not shown. Please contact me if you would like to see this information and I would happily provide it.
These methods project a future return of between R309 and R337 on the low end to R458 and R501 on the high end. The spread is due to different P/Es used to project the future price and some of the other intrinsic factors, i.e. slight differences in the fundamental growth rates of, for instance, EPS vs. Net Income. Faced with this type of spread I choose to be conservative and peg a possible future return at the lower end of the scale or averaging the possible returns (I guess most analysts would choose the top end of the scale to justify purchases). Once I have a relative range of future return I can calculate the expected compound annual return from the various valuations to this range.
Interpreting the results
This table of expected compound annual returns is shown below and requires a little explanation next.
Let's start with the top row showing the spread of various possible future returns (the same as in the table before it). From this I calculate the overall average expected future share price to be R 401.66 in 10 years time. This is our starting point because this is the number I peg as the possible future return expected.
In the left most column, I show the current price (i.e. R 83.00), the discount price from here (i.e. R 58.10), the two Graham intrinsic values (i.e. R 40.99 and R 46.70 respectively), and I calculate at which price you should buy if you would like to earn a compound annual return of 20% given the possible future expected return of R 401.66. This latter number, which is a VERY important number, is calculated to be R 64.87 and is, as a matter of interest, close to half-way between the two Graham valuations and the DCF valuations shown above.
In summary then from the table above if you:
purchase at R83.00 you can expect an possible compound annual return of 16.86%
purchase at R58.10 you can expect an possible compound annual return of 21.11%
purchase at R40.99 you can expect an possible compound annual return of 25.41%
purchase at R46.70 you can expect an possible compound annual return of 23.78%
purchase at R64.87 you can expect an possible compound annual return of 20.00%
Always look at this and keep in mind that Buffett managed to secure 20%-plus compounded annual returns over more than 40 years by buying at the right price and sticking to his strategy.
My recommendation therefore is not to buy at the current price
My thinking about this conclusion is as follows. Truworths is a great company with solid stability, solid growth, great sustainability, and great economics, but at R83.00 per share:
there is no margin of safety in your purchase - something that should worry you!
you are buying a great company at a premium (nothing wrong with this except if you have better investment possibilities)
I would therefore invest in Truworths only if:
I don't have alternative options or,
I could buy it at a price closer to R65.00 per share giving me the margin of safety (on the DCF valuation) I would expect as well as a great expected return of 20% compounded per annum
I hope you have enjoyed this valuation exercise. I hope this posts helped you to gain an understanding of my security valuation thinking process.
Please feel free to contact me in case you have any additional questions or suggestions regarding this, or any other, valuation.
Be extraordinary! Myles Rennie
P.S. The above analysis should not be considered investment advice. I will not be held liable for any investment decisions, or investments, made based on my analysis.
I believe investing is a way of life, a set of values, about employing money to create wealth. Money is critically important in this process, but not for creating short-term gratification, but rather for creating long-term results.
We grow optimally at the edge of comfort and discomfort. I challenge you to create discomfort in your life by spending time, energy, money, and pain to empower yourself toward wealth. I challenge you to create discomfort in your life by delaying short term gratification toward wealth. Your discomfort will lead to long-term gain!
Active Value Investing in South Africa
I strive to create wealth by compounding as much capital for as long as possible by investing according to value, growth and focus principles
Please feel free to contact me at any time if you require value investing training, advice or assistance to perform a comprehensive business valuation or business modeling


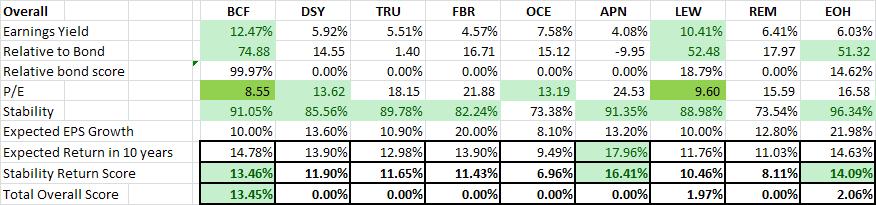
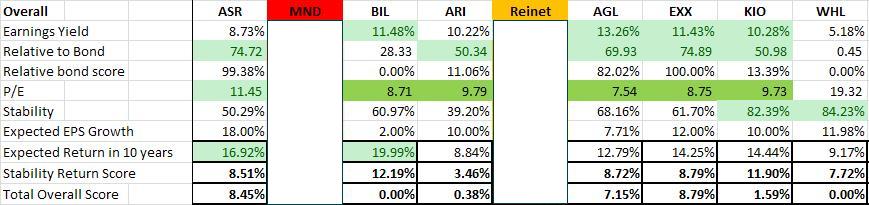

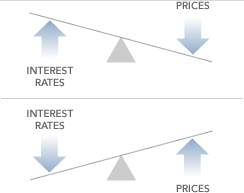

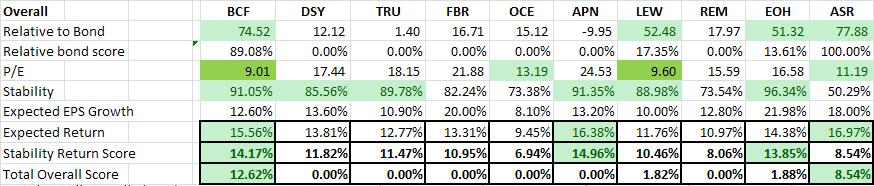

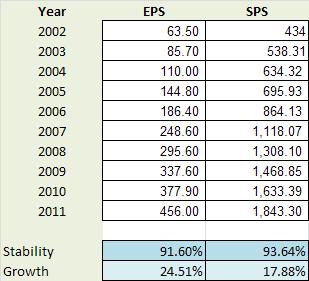
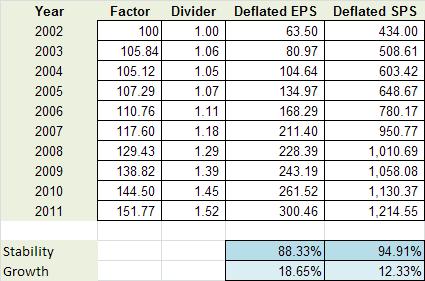
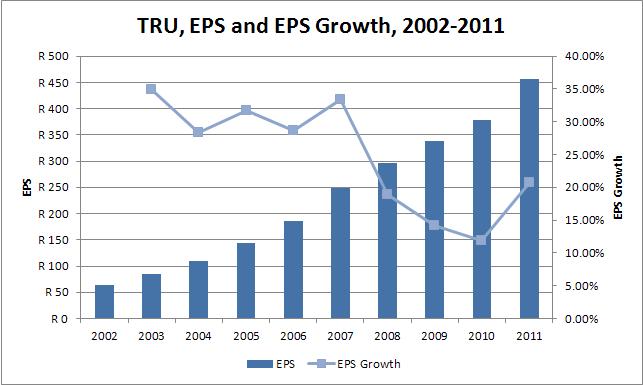
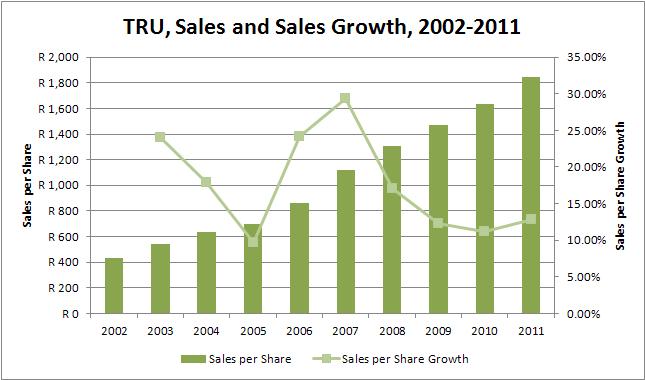
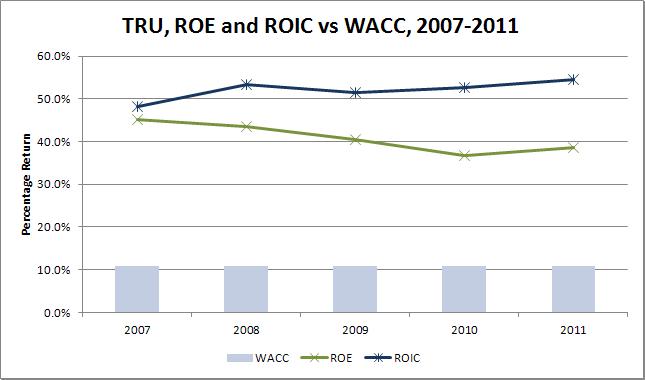
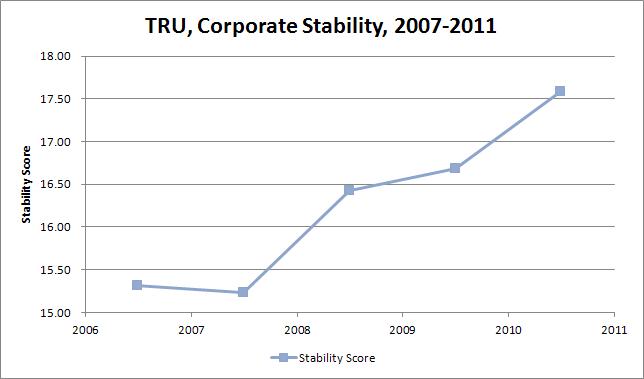
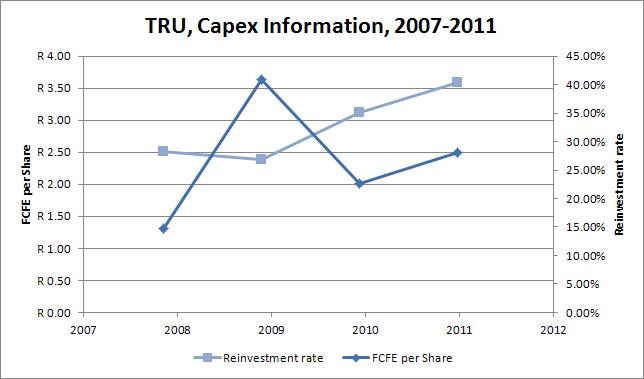
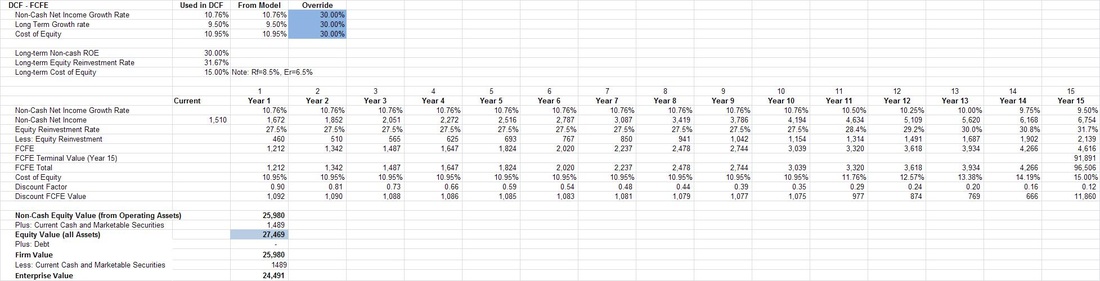
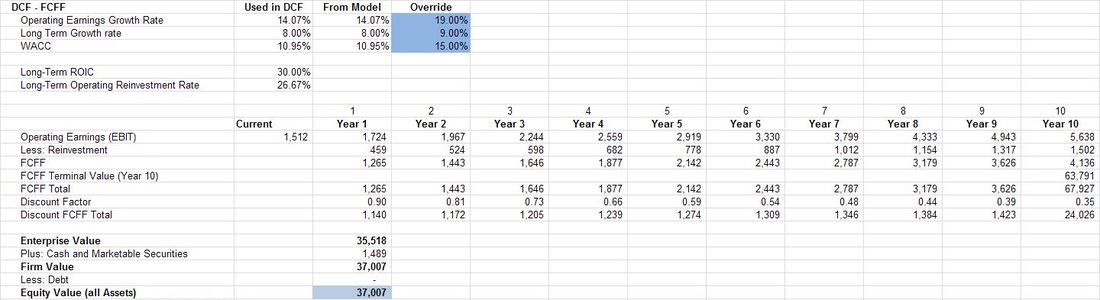
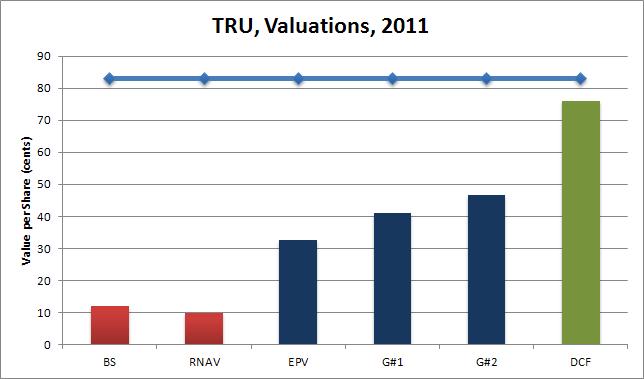
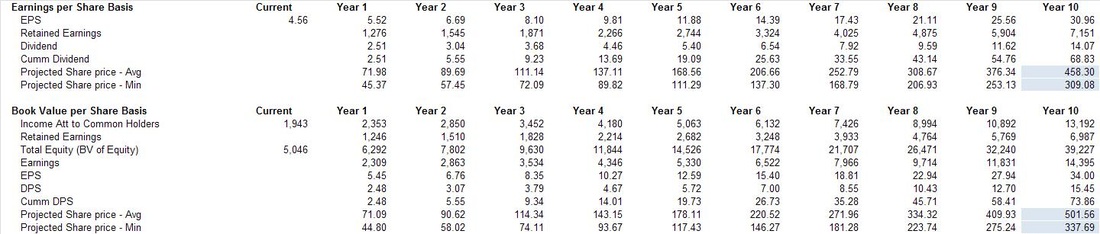
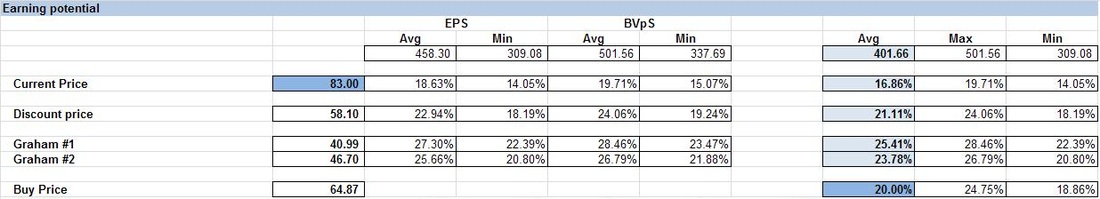
 RSS Feed