
This is another valuation done for Richland IH. We have been considering Truworths as an investment opportunity with some other great South African companies. Truworths is, as this post will show, a great company with some pretty amazing business economics, but it is expensive. Read the post to see what I would recommend for all long-term/patient value investors regarding Truworths.
Our goal at Richland IH is to create sustainable wealth, over the long-term, by following the principles laid down by some of (what I classify to be) the most successful investors of all time. Our investment analysis approach always rests on thorough analysis of the underlying security in order to ensure safety of principal and an adequate return. There are always four major criteria that any investment has to comply with:
Our goal at Richland IH is to create sustainable wealth, over the long-term, by following the principles laid down by some of (what I classify to be) the most successful investors of all time. Our investment analysis approach always rests on thorough analysis of the underlying security in order to ensure safety of principal and an adequate return. There are always four major criteria that any investment has to comply with:
- It should be a simple business to understand within my circle of competence
- It should have good management in place
- It should have a sustainable or durable competitive advantage
- It should have favourable economics
Phase I: is this a company I want to invest in?
In order to determine whether I will invest in this business (please note that I do not refer to a stock as a stock but rather as a business and therefore all valuations are based on logic and sound business principles more than anything else) I would first like to focus on what I call my SGS criteria, i.e. Stability, Growth, and Sustainability of the business.
Stability and Growth of Earnings per Share (EPS) and Sales per Share (SPS) of Truworths
My first criteria in valuing a business is always stability and growth. I am looking for stable businesses growing at an acceptable rate. Stability through a cycle (i.e. through market cycles) demonstrates that the firm can weather storms, pass on price increases to customers, and have management in place that can steer the firm clear of serious fluctuations and danger.
My first criteria in valuing a business is always stability and growth. I am looking for stable businesses growing at an acceptable rate. Stability through a cycle (i.e. through market cycles) demonstrates that the firm can weather storms, pass on price increases to customers, and have management in place that can steer the firm clear of serious fluctuations and danger.
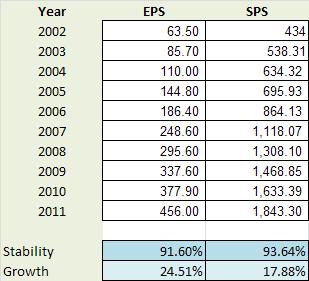 | I measure stability and growth of both EPS and SPS over the past 10 years. 10 years represents one or more market peaks and troughs which allows me to track through-the-cycle stability and growth. I measure these numbers based on year to year EPS and SPS. Stability is expressed as a percentage in the range 0 to 100 percent. A high stability percentage corresponds to high stability and a low stability percentage corresponds to low stability. Stability of 100 percent signifies complete stability, meaning that the data is changing by exactly the same percentage year-on-year. I have developed a number of Microsoft Excel functions to perform these calculations for me. These functions are intelligent enough to remove outliers, weigh more recent data as more important, etc. |
TRU's Earnings per Share stability is 91.6% which is a very high level of stability. Consider the fact that we just survived the second biggest world-wide recession of recorded times and that TRUs EPS does not even show it, and you can't help but be amazed. What is even more amazing is that TRUs Sales per Share (SPS) is stable at 93.6%. This is almost perfectly stable.
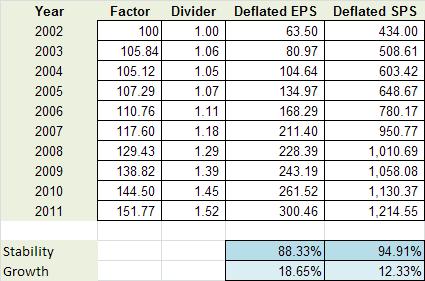 | Next we consider what effect inflation had on TRUs EPS and SPS. From the table it is clear that inflation over the last 10 years impacted TRUs EPS stability slightly negatively whereas it shows that TRUs SPS displays even more stable. The reason I look at deflated (or real) EPS and SPS is to see how sensitive the stability score is to inflationary pressure. The astute investor needs to understand and be satisfied with the firms stability in real and nominal terms. |
From these tables I conclude that I am satisfied with both the nominal and real stability scores of TRU and therefore it is a pass for this criteria. This is the first indicator of a business with a durable competitive advantage.
Next I start considering the compound annual growth rate of EPS and SPS over the past 10 years. As per the stability criteria above, I will consider firm EPS and SPS growth on a real and nominal basis. Inflation, especially in South Africa with relatively high inflation, can lead to 'high' or 'attractive' nominal growth numbers and it is good practice to understand the real growth (note that the Earnings growth rate used when performing a Equity Valuation Discounted Cash Flow (DCF), calculated as the product of the Retention Rate and Return on Equity, is very close to the real EPS growth rate calculated in the table above - thus, the real EPS growth rate is an important number in valuations).
I developed Microsoft Excel functions to calculate the historical growth rate. These functions do not simply calculate the average or compound growth rate of the 8 years, they consider the annual growth rate year on year. TRUs deflated EPS grew by 18.65% year on year wheres its SPS grew lower at 12.33% per year. These are fantastic growth rates considering that the effect of inflation has already been removed. EPS growing at 18.65% compounded annually should take between 4 and 5 years to double, and that sound very attractive indeed. These amazing growth rates (both EPS and SPS) is the second indicator that TRU has a durable competitive advantage. The figures below show respectively EPS vs. EPS Growth, and SPS vs. SPS Growth for TRU.
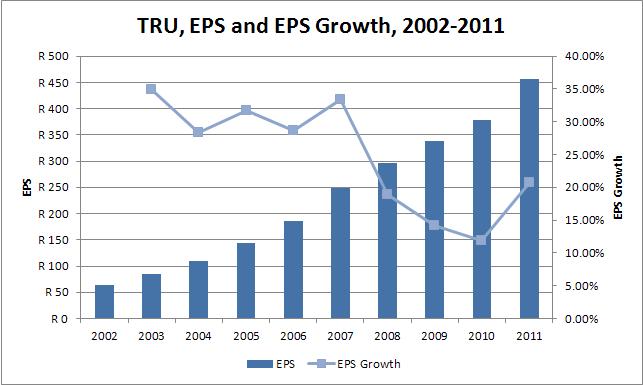 | 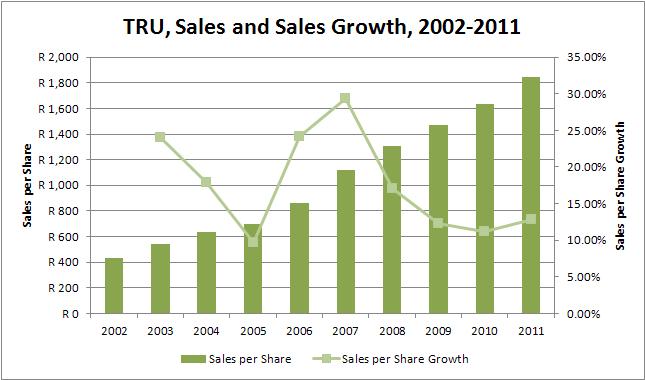 |
I love these two graphs above. Notice that both EPS and SPS growth never slumps below (plus/minus) 10% year-on-year. These graphs point to a business with great economics. I also like the way that both the EPS and SPS growth curves are starting to 'pull-up' and to the right as TRU recovers from the recession. TRU also pass the growth criteria.
I am looking for businesses that have stability percentages of 80 percent or more for both their earnings and their sales. If a company does not satisfy this criterion, I usually just pass it by. After all, if there was little stability in sales and earnings in the past, then it becomes virtually impossible to make confident forecasts for the future.
I am looking for businesses that have stability percentages of 80 percent or more for both their earnings and their sales. If a company does not satisfy this criterion, I usually just pass it by. After all, if there was little stability in sales and earnings in the past, then it becomes virtually impossible to make confident forecasts for the future.
Return on Equity (ROE) and Return on Invested Capital (ROIC) of Truworths
I like companies with an above average Return on Equity (ROE) of at least 18% or better, as this is another indicator that the company has a durable competitive advantage. Because some companies can be financed with debt that is many times their equity, they can show a consistently high ROE, yet still be in unattractive price competitive businesses. To screen out these companies I consider a firms Return on Invested Capital (ROIC) in conjunction with its ROE. A firms ROIC must be higher than 15% and its ROIC must be higher than its Weighted Average Cost of Capital (WACC), else it will fail my screening.
I like companies with an above average Return on Equity (ROE) of at least 18% or better, as this is another indicator that the company has a durable competitive advantage. Because some companies can be financed with debt that is many times their equity, they can show a consistently high ROE, yet still be in unattractive price competitive businesses. To screen out these companies I consider a firms Return on Invested Capital (ROIC) in conjunction with its ROE. A firms ROIC must be higher than 15% and its ROIC must be higher than its Weighted Average Cost of Capital (WACC), else it will fail my screening.
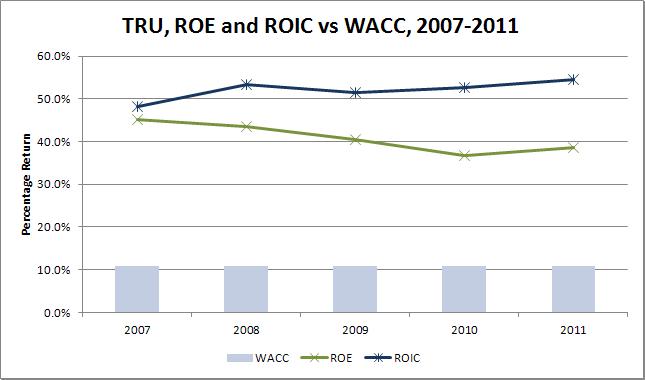 | Keep in mind that if a company can maintain its ROIC consistently above its WACC it is creating value for its shareholders. A company that has a ROIC lower than its WACC, irrespective of the rate of growth of the company, is destroying value. In fact, when ROIC is smaller than WACC, then the faster the company grows the faster it is destroying value! |
Calculating the WACC of a business can be a complex task. There are many different ways of calculating the Cost of Equity and the Cost of Debt of a business. The calculations for TRUs Cost of Equity, Cost of Debt, and WACC is not displayed here, but if required please email me (see my contact form) and I will gladly supply the calculations (and the thinking). In short, I calculated TRUs WACC as follows:
The consistently high ROE and ROIC rates is the third indicator that TRU has a durable competitive advantage.
TRU pass this criteria.
- I took an extremely conservative approach to TRUs year-on-year Cost of Equity. I estimated a BETA of 0.35, a risk free rate of 8.5% and a Equity Premium of 7%. This yielded a Cost of Equity (using CAPM) of 11%
- I used a synthetic bond rating approach to calculate TRU's year-on-year Cost of Debt
The consistently high ROE and ROIC rates is the third indicator that TRU has a durable competitive advantage.
TRU pass this criteria.
Corporate Stability of Truworths
I like companies that demonstrate a high level of corporate stability over the long term. The functions I have developed in Microsoft Excel to measure corporate stability consider a number of different financial ratio's of a firm to determine a stability score. A high corporate stability score is required before considering any investment in the company.
I like companies that demonstrate a high level of corporate stability over the long term. The functions I have developed in Microsoft Excel to measure corporate stability consider a number of different financial ratio's of a firm to determine a stability score. A high corporate stability score is required before considering any investment in the company.
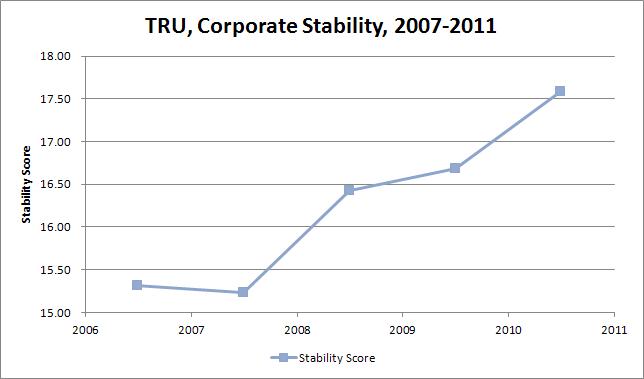 | A score above 8.15 indicates little chance of the business failing based on current management principles. The average stability score for TRU over the last five years has been 16.25 which is much higher than the required 8.15 for a very stable company. |
This is the kind of company I like to invest in, because it has a good chance of still doing what it is doing, and being in business, 10 years from now. TRU is the kind of business I can invest in and forget about, come back in ten years, and it is very likely to still be going strong.
The consistently stability score is the third indicator that TRU has a durable competitive advantage.
TRU pass this criteria.
The consistently stability score is the third indicator that TRU has a durable competitive advantage.
TRU pass this criteria.
Capital expenditure of Truworths
I like companies that do not have major capital expenditures, i.e. I look for companies that do not need to spend a lot of money on major upgrades of plant and equipment or on research and development to stay competitive.
I like companies that do not have major capital expenditures, i.e. I look for companies that do not need to spend a lot of money on major upgrades of plant and equipment or on research and development to stay competitive.
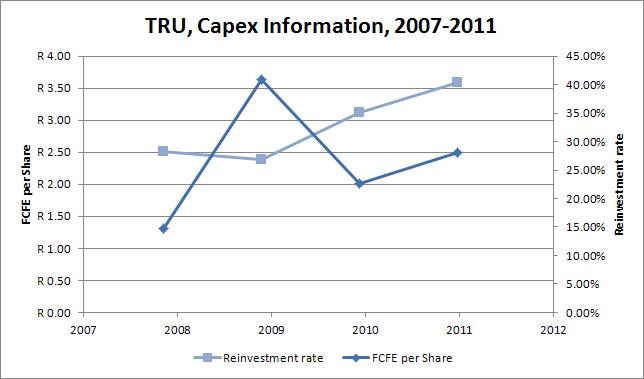 | TRUs free cash flow per share over the past four years are all positive, indicating that the company is generating more cash that it is consuming. Its average FCFE per Share for the last four years was R 2.90. It showed positive Reinvestment Rates over the last four years with an average of 26.6%. This shows that TRU is investing in the future (i.e. investing in its growth assets). |
These are both favorable signs, and so the company passes this criteria.
TRU pass this criteria.
TRU pass this criteria.
Debt position of Truworths
I like businesses that are conservatively financed. Nonetheless, I am willing to invest in firm with solid bond ratings. In South Africa it is not always easy to obtain a bond rating for a firm, and therefore I have developed functions that calculate a synthetic bond rating based on the fundamentals of the business. TRUs synthetic bond rating is calculated as "AAA" based on both its corporate stability rating and the fact that its interest cover ratio is very, very high. In fact, TRU shows no of debt currently on its balance sheet (2011) which is considered exceptional. TRU has very strong earnings and will be able to repay a substantial amount of debt based on it.
TRU pass this criteria.
Use of Retained Earnings by Truworths
This is one of Buffett's main screening criteria, and I love it was well. Buffett likes to see if management has spent retained earnings in a way that benefits shareholders. To determine this, Buffett takes the total amount of retained earnings over the previous 10 years of 1147.11 cents per share and compares it to the gain in EPS over the same period of 390.50 cents. TRUs management has proven it can earn shareholders a 34.2% return on the earnings they kept. This is a fantastic number and one can say that management is doing a great job of putting the retained earnings to work.
TRU pass this criteria.
This concludes the quantitative elements of the Phase I valuation. Next the valuation moves to Phase II.
Phase II: should I buy based on the economics?
If and when I get positive responses to all the above criteria, I then proceed with a value vs. price analysis. The value analysis will determine whether or not the stock of the business should be bought. The following is how I evaluate TRU quantitatively.
I start by understanding the intrinsic value of the business from the perspective of the Balance Sheet, then the Income Statement, and finally I look at the growth value of the business, i.e. Discounted Cash Flow based on Free Cash Flows.
I start by understanding the intrinsic value of the business from the perspective of the Balance Sheet, then the Income Statement, and finally I look at the growth value of the business, i.e. Discounted Cash Flow based on Free Cash Flows.
Intrinsic Valuations
I have decided not to show the BS and IS valuations in this post. Instead I will show the two DCF valuations, i.e. Free Cash Flow to Equity holders (FCFE) and Free Cash flow to the Firm (FCFF) respectively. The FCF valuations value the operating assets in the business, both existing and growth assets. I use the FCF valuations to determine the upper end of intrinsic value (i.e. the more optimistic possible intrinsic values).
Here I performed both FCFE and FCFF valuations, but in both cases calculate the intrinsic equity value of the business, that which a shareholder would be interested in. Enterprise value, as a matter of interest, would be the value that someone buying the entire business would be interested in. Below is the three-stage FCFE calculation.
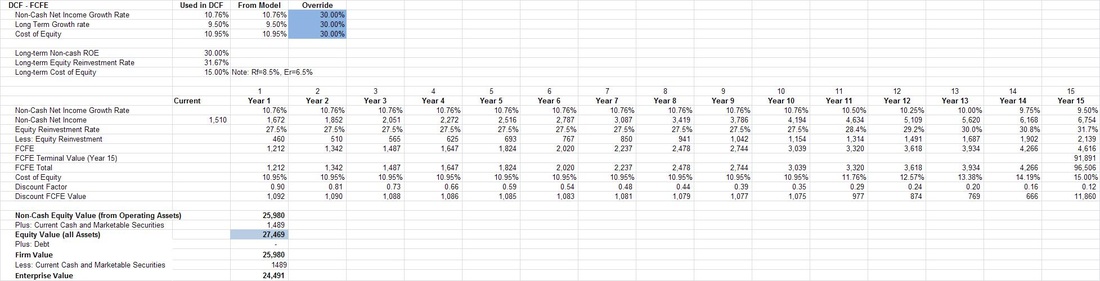
You are more than welcome to contact me if you would like information as to any of these calculations. Below is a two-stage FCFF calculation. I calculated the FCFE and FCFF using different stage models just to see the difference in valuation.
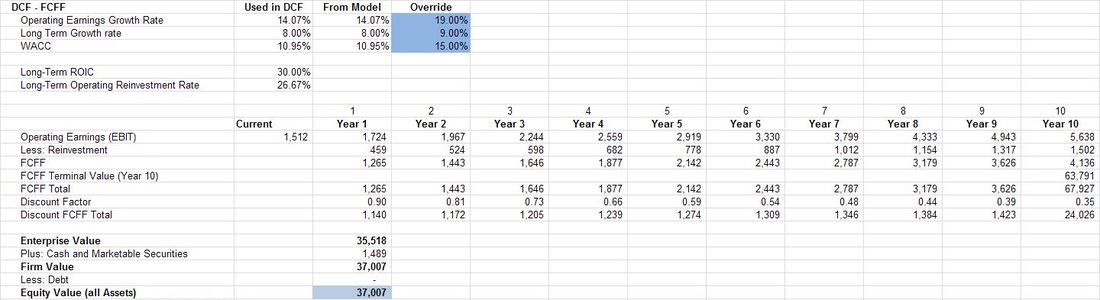
You will notice there is a difference between the two valuations. They should be close together, but there are good fundamental reasons why they could differ. The most relevant is that I don't calculate the FCFF and FCFE from a forecasted Income Statement or Balance Sheet. Rather, I calculate fundamental growth rates for Net Income and Operating Earnings respectively and these rates are based on the average Equity Reinvestment Rate, ROE, Operating Reinvestment Rate, and ROIC of the last five years. Therefore, they will result in differences. Note also that this is a risk for valuation, these slight input variable differences cause large valuation differences.
In the rest of the valuation I use the average of the two values to estimate a more realistic intrinsic DCF value.
In the rest of the valuation I use the average of the two values to estimate a more realistic intrinsic DCF value.
Intrinsic Value - putting it all together
From the exercise above I obtained a number of different intrinsic values for BCF. I usually also do two Graham Valuations as described in Chapter 39 of his 1962 Security Analysis. The value (which is based on earnings) is calculated for TRU using Graham's approach and is shown as G#1 and G#2 in the graph below. Note that BS shows the Replacement Asset intrinsic value. IS shows the Earnings Power Value. DCF show the average DCF values form the perspective of both FCFE and FCFF analysis.
From the exercise above I obtained a number of different intrinsic values for BCF. I usually also do two Graham Valuations as described in Chapter 39 of his 1962 Security Analysis. The value (which is based on earnings) is calculated for TRU using Graham's approach and is shown as G#1 and G#2 in the graph below. Note that BS shows the Replacement Asset intrinsic value. IS shows the Earnings Power Value. DCF show the average DCF values form the perspective of both FCFE and FCFF analysis.
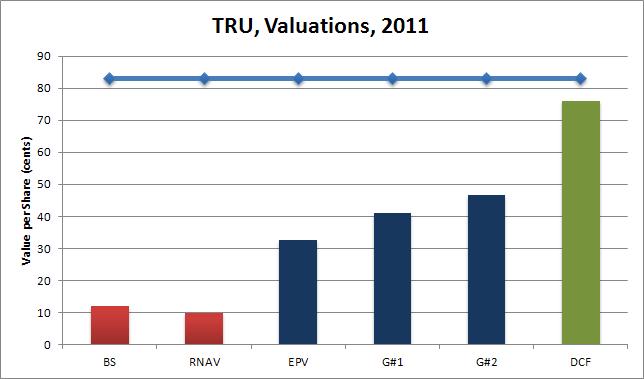
The graph shows the current share price (roughly R 83.00 per share at the time of writing) as the dark blue line at the top of the graph. First you will notice that all intrinsic valuations are less that the current share price - therefore the share can be considered expensive and as having no margin of safety.
You will furthermore note in this graph that both the BS (Balance Sheet Book Value) and RNAV (Replacement Net Asset Value) values are less than the EPV (Earnings Power Value from the Income Statement) value. Also, both the BS and RNAV values are less than the two Graham values (i.e. G#1 and G#2). This is the final indicator that TRU enjoys a durable competitive advantage.
Now notice that EPV , G#1 and G#2 are all less that the valuation considering growth, i.e. DCF (which in this case is the average FCFE and FCFF valuations). The bars in this chart show a classic example of a company with a durable competitive advantage and with considerable growth assets to consider in the valuation. This graph only shows the valuations for 2011, but in my analysis the gaps are consistently positive positive for the last five years.
Based on the analysis above a fair price to pay for TRU (at the end of June 2011) would be somewhere near R 45.00 per share. Paying more than that would imply paying for potential growth, not something a value investor likes to do. Most value investors, like myself, like to buy assets at a discount (which gives a margin of safety). Therefore, a value investors buy price would be 75% of the fair value: R 33.75 = R 45.00 x 75%.
In order to make the final investment decision I have to consider what my potential return on investment (ROI) could be if I bought at the various values presented in the graph above.
Based on the valuations above what is the expected return in 10 years?
The final step in the valuation is to determine what the expected total return (i.e. share price and cumulative dividend's over the next 10 years) value could be in 10 years time given the current book value, earnings per share (EPS), payout ratio, P/E ratio, EPS growth rate, Equity Reinvestment Rate, ROE, Net Income Growth rate. I perform two calculations to determine the possible future share price.
The first method starts from the perspective of the latest EPS and the second method starts from the current book value. Both values work on a similar basis, i.e. project possible EPS in 10 years time, multiply this number by a VERY conservative P/E ratio (based on the minimum P/E over the last 10 years) to get the possible share price in 10 years, and add the expected dividend to be received over the next 10 years to get to total returns expected (IF you leave your dividend in the return - something all value investors ascribe to). The result is the table below showing the two methods. All the details of the EPS growth rates, Net Income growth rates, etc. (all determined from fundamental growth formulas) are not shown. Please contact me if you would like to see this information and I would happily provide it.
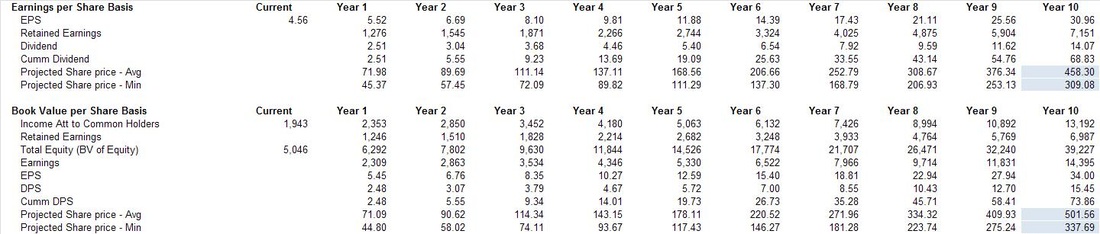
These methods project a future return of between R309 and R337 on the low end to R458 and R501 on the high end. The spread is due to different P/Es used to project the future price and some of the other intrinsic factors, i.e. slight differences in the fundamental growth rates of, for instance, EPS vs. Net Income. Faced with this type of spread I choose to be conservative and peg a possible future return at the lower end of the scale or averaging the possible returns (I guess most analysts would choose the top end of the scale to justify purchases). Once I have a relative range of future return I can calculate the expected compound annual return from the various valuations to this range.
Interpreting the results
This table of expected compound annual returns is shown below and requires a little explanation next.
This table of expected compound annual returns is shown below and requires a little explanation next.
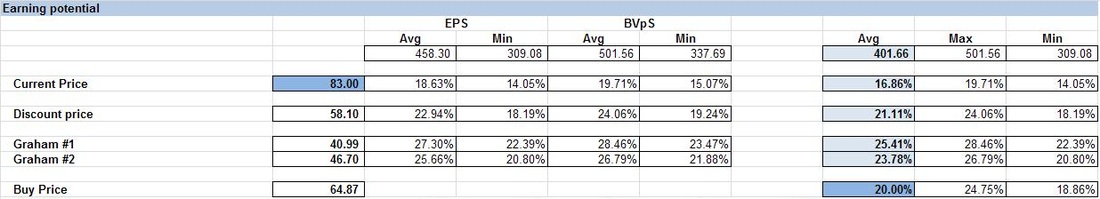
Let's start with the top row showing the spread of various possible future returns (the same as in the table before it). From this I calculate the overall average expected future share price to be R 401.66 in 10 years time. This is our starting point because this is the number I peg as the possible future return expected.
In the left most column, I show the current price (i.e. R 83.00), the discount price from here (i.e. R 58.10), the two Graham intrinsic values (i.e. R 40.99 and R 46.70 respectively), and I calculate at which price you should buy if you would like to earn a compound annual return of 20% given the possible future expected return of R 401.66. This latter number, which is a VERY important number, is calculated to be R 64.87 and is, as a matter of interest, close to half-way between the two Graham valuations and the DCF valuations shown above.
In summary then from the table above if you:
- purchase at R83.00 you can expect an possible compound annual return of 16.86%
- purchase at R58.10 you can expect an possible compound annual return of 21.11%
- purchase at R40.99 you can expect an possible compound annual return of 25.41%
- purchase at R46.70 you can expect an possible compound annual return of 23.78%
- purchase at R64.87 you can expect an possible compound annual return of 20.00%
My recommendation therefore is not to buy at the current price
My thinking about this conclusion is as follows. Truworths is a great company with solid stability, solid growth, great sustainability, and great economics, but at R83.00 per share:
Please feel free to contact me in case you have any additional questions or suggestions regarding this, or any other, valuation.
Be extraordinary!
Myles Rennie
P.S. The above analysis should not be considered investment advice. I will not be held liable for any investment decisions, or investments, made based on my analysis.
My thinking about this conclusion is as follows. Truworths is a great company with solid stability, solid growth, great sustainability, and great economics, but at R83.00 per share:
- there is no margin of safety in your purchase - something that should worry you!
- you are buying a great company at a premium (nothing wrong with this except if you have better investment possibilities)
- I don't have alternative options or,
- I could buy it at a price closer to R65.00 per share giving me the margin of safety (on the DCF valuation) I would expect as well as a great expected return of 20% compounded per annum
Please feel free to contact me in case you have any additional questions or suggestions regarding this, or any other, valuation.
Be extraordinary!
Myles Rennie
P.S. The above analysis should not be considered investment advice. I will not be held liable for any investment decisions, or investments, made based on my analysis.
 RSS Feed