Please note, this is a screening valuation only. This is not a full fledged valuation of the subject shares and therefore should not be used as the final basis for any investment decision.
Prior to performing a detailed valuation on a business, as illustrated in the Truworths or Bowler Metcalf examples below, I perform a ‘screening valuation’ of various businesses in order to determine where I should direct my detailed analysis effort. In order to screen businesses I focus on the following elements or numbers of the considered businesses:
• 10 years of Earnings per Share (EPS) data
• 10 years of deflated EPS data
• 10 years of ROE data
• analyst or consensus forecasted EPS growth rate, if available
• lowest P/E ratio over the last 5 to 10 years
• the average Retention Rate (RR) of the business
• the latest available Book Value per Share (BPS)
Using this set of data for each business considered I calculate a number of ratios and returns for each to help me identify potential value investment candidate businesses. Businesses that pass this initial screen will further be analyzed in detail. From the detailed (individual) analyses investment decisions will be made, i.e. the decision as to where investment capital will be allocated.
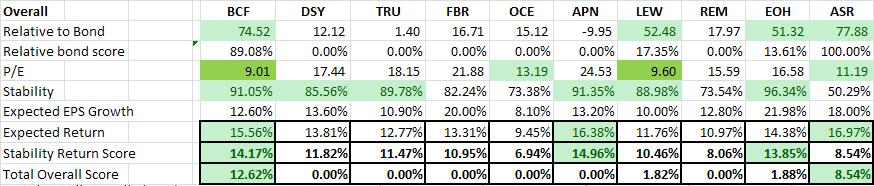
In this post I will be comparing 9 different value stocks as of 8 May 2012. The table below shows the final result of the analysis. This table shows the result of my screening calculations (not shown in this post) and include 8 overall calculations. Below I have described some of them. They are: - Relative to Bond - I calculate the earnings for a share based on the latest earnings per share (EPS) and current share price (i.e. E/P). I then calculate the historical EPS growth rate and, combined with the analyst expected forecasted EPS, estimate the relative EPS for the next 10 years and possible relative share price in 10 years, if I invested R100 in this business today. I then compare this to the return of R100 invested in a 10 year South African government bond
- Stability - I calculate the stability in growth of both the historical EPS and historical Deflated EPS. The stability of growth of Earnings-, Sales- and Book Value per Share are vitally important for any value investor.
- Expected EPS Growth - the expected EPS growth is based on the historical growth rate and the analyst estimate. The expected EPS growth is very conservative to ensure that we rather under-promise and over-deliver than the alternative.
- Expected Return - the compounded annual rate of return is estimated using two different techniques. The first considers the EPS growth over the next 10 years and the second considers the growth in book value over the next 10 years. Both estimate the future share price from these numbers, includes the possible dividends over the next 10 years, and then calculates the expected compound annual return. As can be expected these approaches produce different results, and the final expected return is the average of the two results.
- Stability Return Score - we now come to the crux of the matter. I take the stability score and multiply it with the expected return. This gives me a stability return score, i.e. the expected return impaired for the stability (or instability) of the earnings history. The stability return score forms the basis of the decision whether to further investigate, i.e. perform a detailed analysis of, the business.
- Total Overall Score - I use the stability return score, multiplied by the relative bond score, to calculate the combined effect of the expected return and relative performance to a R100 10 year South African government bond.
The relative ratios and numbers calculated above allow me to screen various possible investments in order to identify the best possible investment candidates. There are a number of other screens not shown here, e.g. price-to-earnings ratio's, price-to-book ratio's, etc. My recommendationsI hope you have enjoyed this short valuation example. Based on the above I further analysed (in detail) Bowler Metcalf, Discovery Holdings and Assore. Finally, after the detailed analysis of each, I made my investment recommendations for Richland IH and we allocated investment capital based on those decisions. Please feel free to contact me in case you have any additional questions or suggestions regarding this, or any other, valuation. Be extraordinary!
Myles Rennie
P.S. The above analysis should not be considered investment advice. I will not be held liable for any investment decisions, or investments, made based on my analysis.
 This is another valuation done for Richland IH. We have been considering Truworths as an investment opportunity with some other great South African companies. Truworths is, as this post will show, a great company with some pretty amazing business economics, but it is expensive. Read the post to see what I would recommend for all long-term/patient value investors regarding Truworths. Our goal at Richland IH is to create sustainable wealth, over the long-term, by following the principles laid down by some of (what I classify to be) the most successful investors of all time. Our investment analysis approach always rests on thorough analysis of the underlying security in order to ensure safety of principal and an adequate return. There are always four major criteria that any investment has to comply with: - It should be a simple business to understand within my circle of competence
- It should have good management in place
- It should have a sustainable or durable competitive advantage
- It should have favourable economics
In the valuations I post here I focus on the last two criteria and demonstrate below how I consider these. Without further delay, let's delve into Truworths (ticker symbol: TRU).
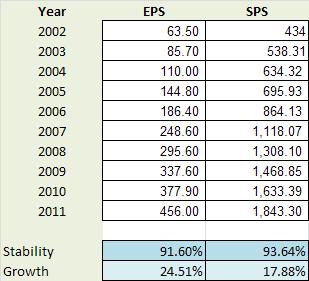
Phase I: is this a company I want to invest in? In order to determine whether I will invest in this business (please note that I do not refer to a stock as a stock but rather as a business and therefore all valuations are based on logic and sound business principles more than anything else) I would first like to focus on what I call my SGS criteria, i.e. Stability, Growth, and Sustainability of the business. Stability and Growth of Earnings per Share (EPS) and Sales per Share (SPS) of Truworths
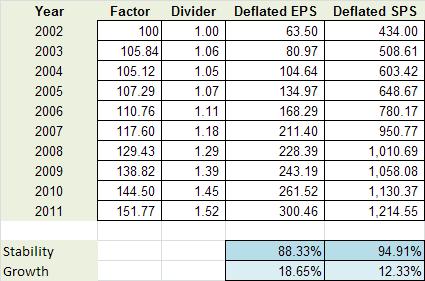
My first criteria in valuing a business is always stability and growth. I am looking for stable businesses growing at an acceptable rate. Stability through a cycle (i.e. through market cycles) demonstrates that the firm can weather storms, pass on price increases to customers, and have management in place that can steer the firm clear of serious fluctuations and danger. | | I measure stability and growth of both EPS and SPS over the past 10 years. 10 years represents one or more market peaks and troughs which allows me to track through-the-cycle stability and growth. I measure these numbers based on year to year EPS and SPS. Stability is expressed as a percentage in the range 0 to 100 percent. A high stability percentage corresponds to high stability and a low stability percentage corresponds to low stability. Stability of 100 percent signifies complete stability, meaning that the data is changing by exactly the same percentage year-on-year. I have developed a number of Microsoft Excel functions to perform these calculations for me. These functions are intelligent enough to remove outliers, weigh more recent data as more important, etc. | TRU's Earnings per Share stability is 91.6% which is a very high level of stability. Consider the fact that we just survived the second biggest world-wide recession of recorded times and that TRUs EPS does not even show it, and you can't help but be amazed. What is even more amazing is that TRUs Sales per Share (SPS) is stable at 93.6%. This is almost perfectly stable. | | Next we consider what effect inflation had on TRUs EPS and SPS. From the table it is clear that inflation over the last 10 years impacted TRUs EPS stability slightly negatively whereas it shows that TRUs SPS displays even more stable. The reason I look at deflated (or real) EPS and SPS is to see how sensitive the stability score is to inflationary pressure. The astute investor needs to understand and be satisfied with the firms stability in real and nominal terms. | From these tables I conclude that I am satisfied with both the nominal and real stability scores of TRU and therefore it is a pass for this criteria. This is the first indicator of a business with a durable competitive advantage.
Next I start considering the compound annual growth rate of EPS and SPS over the past 10 years. As per the stability criteria above, I will consider firm EPS and SPS growth on a real and nominal basis. Inflation, especially in South Africa with relatively high inflation, can lead to 'high' or 'attractive' nominal growth numbers and it is good practice to understand the real growth (note that the Earnings growth rate used when performing a Equity Valuation Discounted Cash Flow (DCF), calculated as the product of the Retention Rate and Return on Equity, is very close to the real EPS growth rate calculated in the table above - thus, the real EPS growth rate is an important number in valuations).
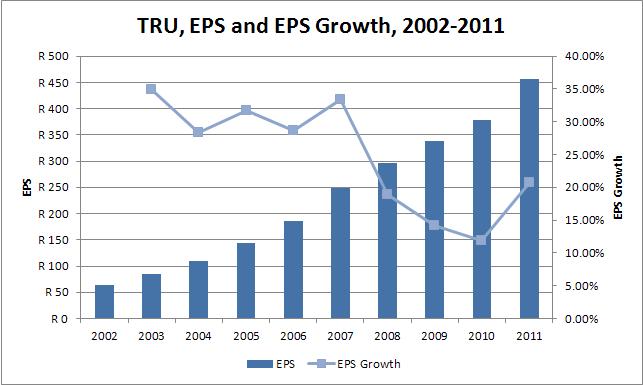
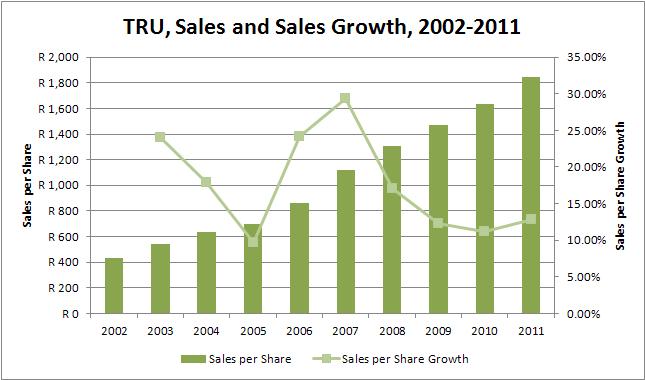
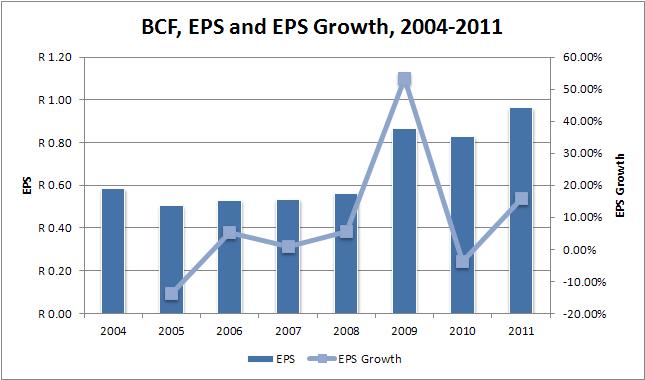
I developed Microsoft Excel functions to calculate the historical growth rate. These functions do not simply calculate the average or compound growth rate of the 8 years, they consider the annual growth rate year on year. TRUs deflated EPS grew by 18.65% year on year wheres its SPS grew lower at 12.33% per year. These are fantastic growth rates considering that the effect of inflation has already been removed. EPS growing at 18.65% compounded annually should take between 4 and 5 years to double, and that sound very attractive indeed. These amazing growth rates (both EPS and SPS) is the second indicator that TRU has a durable competitive advantage. The figures below show respectively EPS vs. EPS Growth, and SPS vs. SPS Growth for TRU.
I love these two graphs above. Notice that both EPS and SPS growth never slumps below (plus/minus) 10% year-on-year. These graphs point to a business with great economics. I also like the way that both the EPS and SPS growth curves are starting to 'pull-up' and to the right as TRU recovers from the recession. TRU also pass the growth criteria.
I am looking for businesses that have stability percentages of 80 percent or more for both their earnings and their sales. If a company does not satisfy this criterion, I usually just pass it by. After all, if there was little stability in sales and earnings in the past, then it becomes virtually impossible to make confident forecasts for the future.
Return on Equity (ROE) and Return on Invested Capital (ROIC) of Truworths
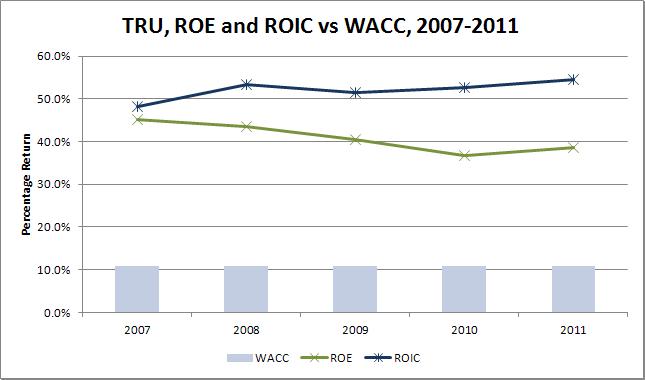
I like companies with an above average Return on Equity (ROE) of at least 18% or better, as this is another indicator that the company has a durable competitive advantage. Because some companies can be financed with debt that is many times their equity, they can show a consistently high ROE, yet still be in unattractive price competitive businesses. To screen out these companies I consider a firms Return on Invested Capital (ROIC) in conjunction with its ROE. A firms ROIC must be higher than 15% and its ROIC must be higher than its Weighted Average Cost of Capital (WACC), else it will fail my screening.
| | Keep in mind that if a company can maintain its ROIC consistently above its WACC it is creating value for its shareholders. A company that has a ROIC lower than its WACC, irrespective of the rate of growth of the company, is destroying value. In fact, when ROIC is smaller than WACC, then the faster the company grows the faster it is destroying value!
| Calculating the WACC of a business can be a complex task. There are many different ways of calculating the Cost of Equity and the Cost of Debt of a business. The calculations for TRUs Cost of Equity, Cost of Debt, and WACC is not displayed here, but if required please email me (see my contact form) and I will gladly supply the calculations (and the thinking). In short, I calculated TRUs WACC as follows: - I took an extremely conservative approach to TRUs year-on-year Cost of Equity. I estimated a BETA of 0.35, a risk free rate of 8.5% and a Equity Premium of 7%. This yielded a Cost of Equity (using CAPM) of 11%
- I used a synthetic bond rating approach to calculate TRU's year-on-year Cost of Debt
From the graph above it is clear the TRU has a fantastic ROE at an average 40%. Its ROIC is even better at an average of more than 50%. This implies that for every RAND of debt or equity provided to Truworths it generates about R 0.50 (or 50 cents) return per annum. This is truly amazing! TRUs average ROE is much higher than the required 18% and the average ROIC is also much higher than the required 15%. Furthermore, the ROIC is much higher than the average WACC of 10.9%. Therefore, management is creating value for shareholders at a fantastic pace. The consistently high ROE and ROIC rates is the third indicator that TRU has a durable competitive advantage. TRU pass this criteria. Corporate Stability of Truworths
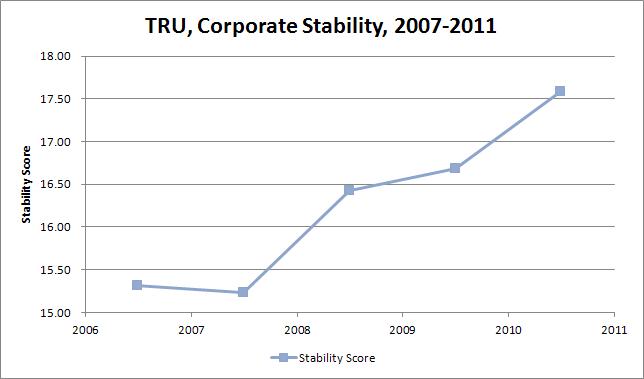
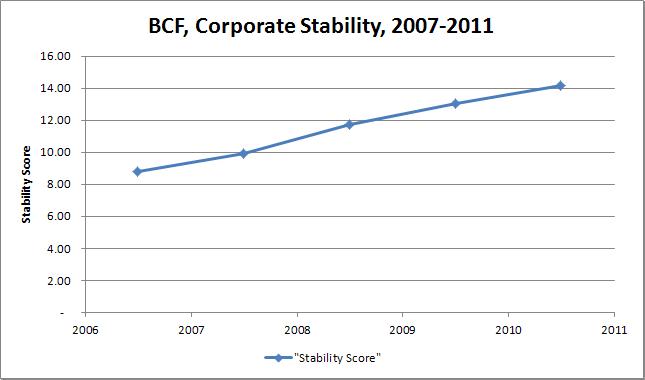
I like companies that demonstrate a high level of corporate stability over the long term. The functions I have developed in Microsoft Excel to measure corporate stability consider a number of different financial ratio's of a firm to determine a stability score. A high corporate stability score is required before considering any investment in the company. | | A score above 8.15 indicates little chance of the business failing based on current management principles. The average stability score for TRU over the last five years has been 16.25 which is much higher than the required 8.15 for a very stable company.
| This is the kind of company I like to invest in, because it has a good chance of still doing what it is doing, and being in business, 10 years from now. TRU is the kind of business I can invest in and forget about, come back in ten years, and it is very likely to still be going strong.
The consistently stability score is the third indicator that TRU has a durable competitive advantage.
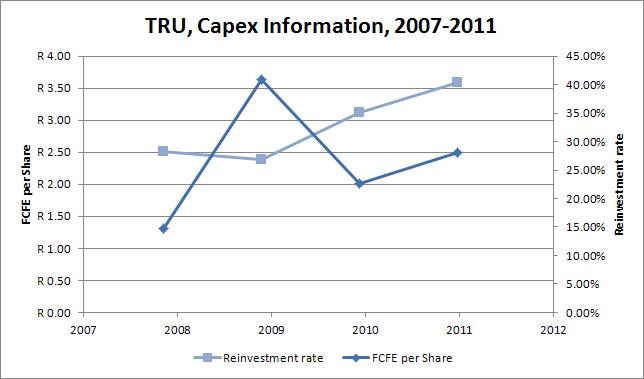
TRU pass this criteria. Capital expenditure of Truworths
I like companies that do not have major capital expenditures, i.e. I look for companies that do not need to spend a lot of money on major upgrades of plant and equipment or on research and development to stay competitive. | | TRUs free cash flow per share over the past four years are all positive, indicating that the company is generating more cash that it is consuming. Its average FCFE per Share for the last four years was R 2.90. It showed positive Reinvestment Rates over the last four years with an average of 26.6%. This shows that TRU is investing in the future (i.e. investing in its growth assets).
| These are both favorable signs, and so the company passes this criteria.
TRU pass this criteria. Debt position of Truworths
I like businesses that are conservatively financed. Nonetheless, I am willing to invest in firm with solid bond ratings. In South Africa it is not always easy to obtain a bond rating for a firm, and therefore I have developed functions that calculate a synthetic bond rating based on the fundamentals of the business. TRUs synthetic bond rating is calculated as "AAA" based on both its corporate stability rating and the fact that its interest cover ratio is very, very high. In fact, TRU shows no of debt currently on its balance sheet (2011) which is considered exceptional. TRU has very strong earnings and will be able to repay a substantial amount of debt based on it.
TRU pass this criteria. Use of Retained Earnings by Truworths
This is one of Buffett's main screening criteria, and I love it was well. Buffett likes to see if management has spent retained earnings in a way that benefits shareholders. To determine this, Buffett takes the total amount of retained earnings over the previous 10 years of 1147.11 cents per share and compares it to the gain in EPS over the same period of 390.50 cents. TRUs management has proven it can earn shareholders a 34.2% return on the earnings they kept. This is a fantastic number and one can say that management is doing a great job of putting the retained earnings to work.
TRU pass this criteria.
This concludes the quantitative elements of the Phase I valuation. Next the valuation moves to Phase II. Phase II: should I buy based on the economics? If and when I get positive responses to all the above criteria, I then proceed with a value vs. price analysis. The value analysis will determine whether or not the stock of the business should be bought. The following is how I evaluate TRU quantitatively.
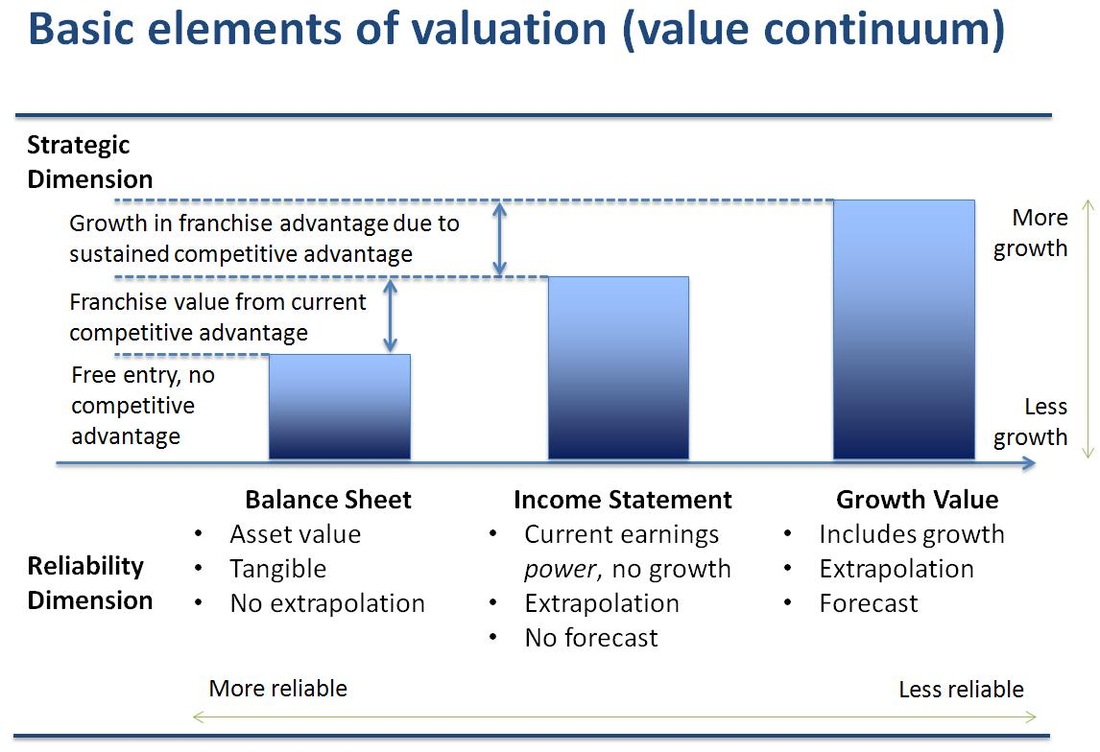
I start by understanding the intrinsic value of the business from the perspective of the Balance Sheet, then the Income Statement, and finally I look at the growth value of the business, i.e. Discounted Cash Flow based on Free Cash Flows. Intrinsic Valuations
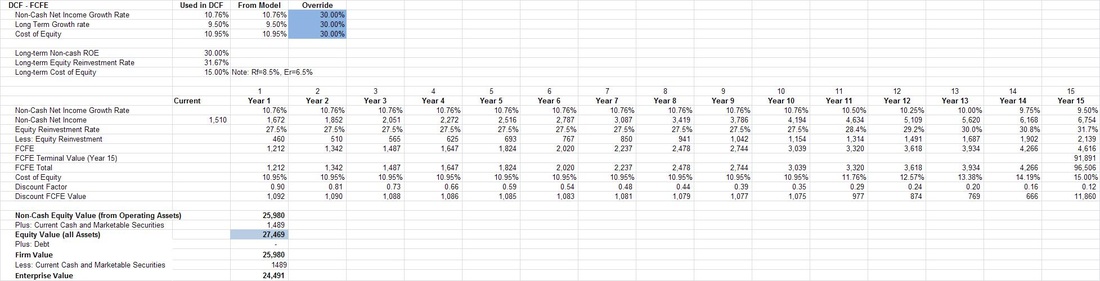
I have decided not to show the BS and IS valuations in this post. Instead I will show the two DCF valuations, i.e. Free Cash Flow to Equity holders (FCFE) and Free Cash flow to the Firm (FCFF) respectively. The FCF valuations value the operating assets in the business, both existing and growth assets. I use the FCF valuations to determine the upper end of intrinsic value (i.e. the more optimistic possible intrinsic values).
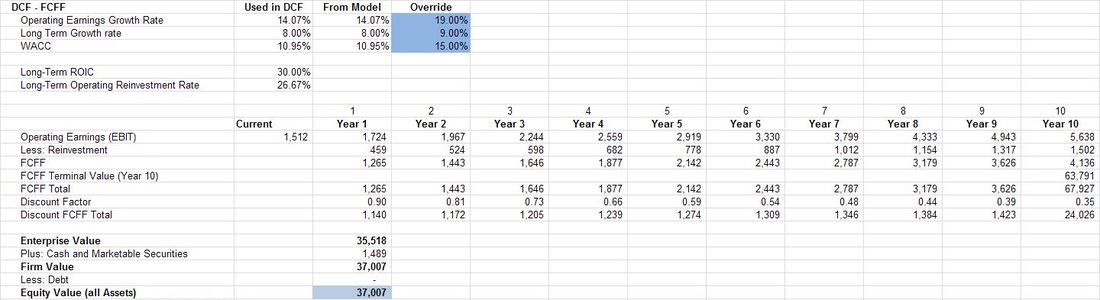
Here I performed both FCFE and FCFF valuations, but in both cases calculate the intrinsic equity value of the business, that which a shareholder would be interested in. Enterprise value, as a matter of interest, would be the value that someone buying the entire business would be interested in. Below is the three-stage FCFE calculation. You are more than welcome to contact me if you would like information as to any of these calculations. Below is a two-stage FCFF calculation. I calculated the FCFE and FCFF using different stage models just to see the difference in valuation. You will notice there is a difference between the two valuations. They should be close together, but there are good fundamental reasons why they could differ. The most relevant is that I don't calculate the FCFF and FCFE from a forecasted Income Statement or Balance Sheet. Rather, I calculate fundamental growth rates for Net Income and Operating Earnings respectively and these rates are based on the average Equity Reinvestment Rate, ROE, Operating Reinvestment Rate, and ROIC of the last five years. Therefore, they will result in differences. Note also that this is a risk for valuation, these slight input variable differences cause large valuation differences.
In the rest of the valuation I use the average of the two values to estimate a more realistic intrinsic DCF value. Intrinsic Value - putting it all together
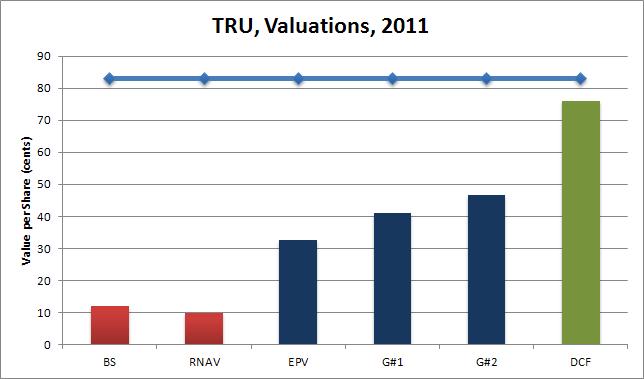
From the exercise above I obtained a number of different intrinsic values for BCF. I usually also do two Graham Valuations as described in Chapter 39 of his 1962 Security Analysis. The value (which is based on earnings) is calculated for TRU using Graham's approach and is shown as G#1 and G#2 in the graph below. Note that BS shows the Replacement Asset intrinsic value. IS shows the Earnings Power Value. DCF show the average DCF values form the perspective of both FCFE and FCFF analysis. The graph shows the current share price (roughly R 83.00 per share at the time of writing) as the dark blue line at the top of the graph. First you will notice that all intrinsic valuations are less that the current share price - therefore the share can be considered expensive and as having no margin of safety.
You will furthermore note in this graph that both the BS (Balance Sheet Book Value) and RNAV (Replacement Net Asset Value) values are less than the EPV (Earnings Power Value from the Income Statement) value. Also, both the BS and RNAV values are less than the two Graham values (i.e. G#1 and G#2). This is the final indicator that TRU enjoys a durable competitive advantage.
Now notice that EPV , G#1 and G#2 are all less that the valuation considering growth, i.e. DCF (which in this case is the average FCFE and FCFF valuations). The bars in this chart show a classic example of a company with a durable competitive advantage and with considerable growth assets to consider in the valuation. This graph only shows the valuations for 2011, but in my analysis the gaps are consistently positive positive for the last five years.
Based on the analysis above a fair price to pay for TRU (at the end of June 2011) would be somewhere near R 45.00 per share. Paying more than that would imply paying for potential growth, not something a value investor likes to do. Most value investors, like myself, like to buy assets at a discount (which gives a margin of safety). Therefore, a value investors buy price would be 75% of the fair value: R 33.75 = R 45.00 x 75%.
In order to make the final investment decision I have to consider what my potential return on investment (ROI) could be if I bought at the various values presented in the graph above. Based on the valuations above what is the expected return in 10 years?
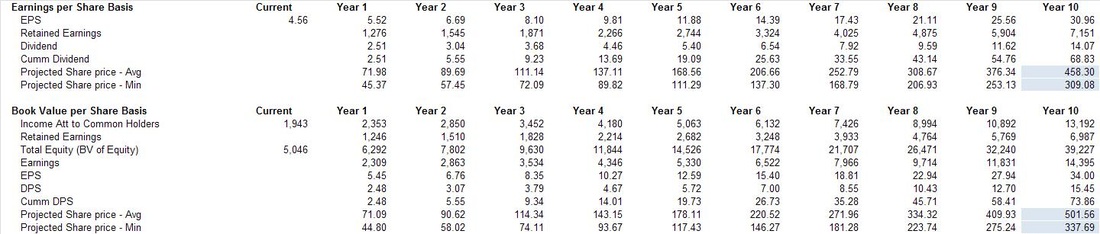
The final step in the valuation is to determine what the expected total return (i.e. share price and cumulative dividend's over the next 10 years) value could be in 10 years time given the current book value, earnings per share (EPS), payout ratio, P/E ratio, EPS growth rate, Equity Reinvestment Rate, ROE, Net Income Growth rate. I perform two calculations to determine the possible future share price.
The first method starts from the perspective of the latest EPS and the second method starts from the current book value. Both values work on a similar basis, i.e. project possible EPS in 10 years time, multiply this number by a VERY conservative P/E ratio (based on the minimum P/E over the last 10 years) to get the possible share price in 10 years, and add the expected dividend to be received over the next 10 years to get to total returns expected (IF you leave your dividend in the return - something all value investors ascribe to). The result is the table below showing the two methods. All the details of the EPS growth rates, Net Income growth rates, etc. (all determined from fundamental growth formulas) are not shown. Please contact me if you would like to see this information and I would happily provide it. These methods project a future return of between R309 and R337 on the low end to R458 and R501 on the high end. The spread is due to different P/Es used to project the future price and some of the other intrinsic factors, i.e. slight differences in the fundamental growth rates of, for instance, EPS vs. Net Income. Faced with this type of spread I choose to be conservative and peg a possible future return at the lower end of the scale or averaging the possible returns (I guess most analysts would choose the top end of the scale to justify purchases). Once I have a relative range of future return I can calculate the expected compound annual return from the various valuations to this range. Interpreting the results
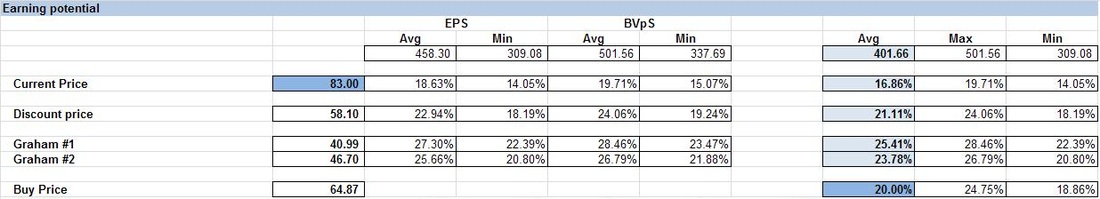
This table of expected compound annual returns is shown below and requires a little explanation next. Let's start with the top row showing the spread of various possible future returns (the same as in the table before it). From this I calculate the overall average expected future share price to be R 401.66 in 10 years time. This is our starting point because this is the number I peg as the possible future return expected. In the left most column, I show the current price (i.e. R 83.00), the discount price from here (i.e. R 58.10), the two Graham intrinsic values (i.e. R 40.99 and R 46.70 respectively), and I calculate at which price you should buy if you would like to earn a compound annual return of 20% given the possible future expected return of R 401.66. This latter number, which is a VERY important number, is calculated to be R 64.87 and is, as a matter of interest, close to half-way between the two Graham valuations and the DCF valuations shown above. In summary then from the table above if you: - purchase at R83.00 you can expect an possible compound annual return of 16.86%
- purchase at R58.10 you can expect an possible compound annual return of 21.11%
- purchase at R40.99 you can expect an possible compound annual return of 25.41%
- purchase at R46.70 you can expect an possible compound annual return of 23.78%
- purchase at R64.87 you can expect an possible compound annual return of 20.00%
Always look at this and keep in mind that Buffett managed to secure 20%-plus compounded annual returns over more than 40 years by buying at the right price and sticking to his strategy. My recommendation therefore is not to buy at the current priceMy thinking about this conclusion is as follows. Truworths is a great company with solid stability, solid growth, great sustainability, and great economics, but at R83.00 per share: - there is no margin of safety in your purchase - something that should worry you!
- you are buying a great company at a premium (nothing wrong with this except if you have better investment possibilities)
I would therefore invest in Truworths only if: - I don't have alternative options or,
- I could buy it at a price closer to R65.00 per share giving me the margin of safety (on the DCF valuation) I would expect as well as a great expected return of 20% compounded per annum
I hope you have enjoyed this valuation exercise. I hope this posts helped you to gain an understanding of my security valuation thinking process. Please feel free to contact me in case you have any additional questions or suggestions regarding this, or any other, valuation. Be extraordinary!
Myles Rennie
P.S. The above analysis should not be considered investment advice. I will not be held liable for any investment decisions, or investments, made based on my analysis.
Valuation Basics - The Financial Statements 1 Before I start my next valuation (it will be done on Assore Limited) I want to spend some time focusing on why and how value investors look at both the Balance Sheet and Income Statement of a company when performing a detailed analysis of a company. OverviewMany people don't like spending time reviewing financial statements. There are many reasons for this, e.g. they might not understand it, it might be too much work, they could be following an investment strategy that does not require study of any financial statements. Unfortunately (or in my case fortunately) the true value investor has to spend time studying these black-and-white pages containing the information required to make good investment decisions. For a value investor the intrinsic value of an investment lies hidden in the financial statements. By gaining a rudimentary understanding of these (easier than expected) documents investors will find that they are not as scary as they first seem. When studying financial statements there are my point to consider. The value investor should consider that: - The balance sheet tells about the firms Assets, Debt and Equity. Assets, the core of most businesses (at least most value investment businesses), can tell about stability, safety, growth potential, and the quality of management. Debt can help firms grow, but increases the riskiness of a business during economic distress. Debt places a burden on earnings and too much of it has lead to the downfall of many businesses.
- The income statement tells about a firms revenue, quality of earnings, sales vs. operational efficiency, has the ability to highlight potential, earnings, and the quality of management.
I will here again repeat Benjamin Graham's definition of an investment: "it is an operation which, upon thorough analysis, promises safety of principal and an adequate return. Operations not meeting these requirements are speculative." Safety, in Graham's opinion, is measured in terms of stability based on known information. When valuing stocks (i.e. determining intrinsic value) Graham focused on current information contained in financial statements, and not as much on predicting the future. In a speech in 1975 he is quoted as saying: "I have resolutely turned my back on efforts to predict the future." Intrinsic value is an elusive concept. Ask 10 people to value an asset and you will receive 10 different answers. Value investors have been debating for many years whether to focus on the quality of assets and the balance sheet or whether to focus on the quality of earnings and the income statement to determine intrinsic value. Even the best known value investor of all time, Warren Buffett, has changed his opinion on this matter over the years. In the past he often emphasized the importance of the income statement (for quality earnings and growth) and in recent years he has shifted partially back to assets that can sustain and help a firm in times of recession, inflation, etc. Irving Khan, Graham's teaching assistant at Colombia University, said: "We stress balance sheet and assets. We're old fashioned because our paramount aim is preservation of capital." Walter Schloss, another of Graham's disciples who recently passed away, also emphasized the importance of the balance sheet. These investors all obtained impressive compound annual returns over many years. I prefer a balanced valuation view to include the following three elements: - Existing assets derived from the balance sheet
- Earnings power derived from the income statement
- Growth assets, and related earnings potential, derived from growth assets (determined by reinvestment rates, etc.) on the balance sheet
If a company can present a compelling investment opportunity based on all three investment approaches, then I feel comfortable to consider investing, but only if I can buy at the right price and after passing my Phase I criteria. Balance SheetI like Janet Lowe's analogy of the income statement and balance sheet in her book The Triumph of Value Investing. She says that if a firm was a ship the balance sheet would be the hull and the income statement would be the sails. The hull keeps the business afloat while the sails - propelled by sales - moves it forward. With this analogy in mind, let's start considering what details of a business' hull do we need to check in order to determine whether it will remain afloat. The balance sheet works according to a simple core relationship, and it is: Assets = Liabilities + Shareholder Equity Balance sheets work based on accrual accounting, meaning that revenue and expenses are recognized in the periods in which they are incurred, irrespective of whether cash was involved. It is therefore a statement of financial position, a snapshot of the assets and liabilities at a single point in time. When I start looking at the balance sheet, I focus on five key aspects: - Existing assets
- Growth assets
- Cash, marketable securities and investments
- Debt
- Equity, dividends and retained earnings
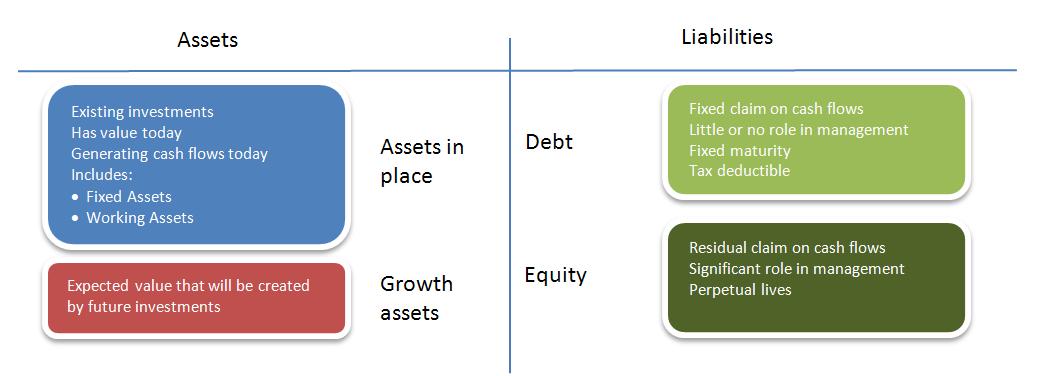
AssetsLet's first consider the difference between existing assets vs. growth assets. Aswath Damodaran, in his book Demodaran on Valuation: Security Analysis for Investment and Corporate Finance, argues that the value of a business could be considered the sum of the values of the individual assets owned by the business, as opposed to the discounted value of all expected future cash flows generated by the assets the business owns. He favours valuing businesses as going concerns, i.e. discounting the conservative future free cash cash flow of the business (generated by assets it already owns and assets it expects to invest in in future) by a risk-adjusted discount factor. To better understand these two 'classes' of assets he proposes visualizing the balance sheet in the form of a 'financial balance sheet' (as opposed to an accounting balance sheet) with investments already made as 'assets in place' and investments we expect to make in the future are 'growth assets'. | | When I do a asset-based valuation, i.e. to determine either book value or replacement asset value, I am focusing only on the existing assets in place and ignore growth assets completely.
| Growth assets only play a role in my growth valuation, performed as the last of three valuation techniques to determine the intrinsic value of a firm (see the image in the section The Value Continuum below). It is clear the picture above that pure asset-based valuations will yield lower values than going concern (or growth) valuations. A couple of brief ideas on assets. Assets are classified as either current or non-current and then there is the distinction between tangible and intangible assets. Current assets are defined as anything that will be turned into cash within 12 months under normal operating conditions. These include cash, cash equivalents, short-term investments, accounts receivable, inventory, and different types of prepaid accounts (e.g. tax). All other assets are non-current assets. Assets can alternatively be classified as tangible or intangible. Tangible assets are sometimes called hard assets and include things like inventory, property, plant, equipment, and cash. All other assets are classified as intangible. CashCash gives a company the ability to weather hard times or take opportunities. On the other hand cash does not earn good returns. Stable cash positions indicates the existence of a durable competitive advantage (in cases where debt levels are consistently low - else debt can be used to smooth cash positions) and eludes to quality, conservative management. Too little cash can constrain the business and stop it from growing or staying afloat. In order to calculate growth assets intrinsic value I will return to cash and specifically the concept of Free Cash Flow, i.e. cash available to the firm or to equity holders after working capital and capital expenditure requirements have been considered. What I would like to say here is that stability in free cash flow, and more specifically positive average free cash flow, is important to the value investor. Free cash flow could be negative for many reasons and could: - signal good things in future, e.g. high growth companies investing more than it is earning
- signal danger, e.g. companies slowly dying and has negative earnings or consuming itself by divesting assets or shrinking capital
- signal possible good returns, e.g. companies that in the past over-invested (capital overspending) and could now benefit from it in the next couple of years
- signal that management might make new stock issues or raise debt (in the case of persistent, even short-term, negative FCFE)
Understanding cash positions, working cash, excess cash, free cash flow, and the application of cash in a company is very important...and a subject on its own. Liabilities and Equity to be discussed in a following post, i.e. Financial Statements 2Typical Asset AdjustmentsPerforming either book value, replacement value, or liquidation value revaluations requires adjustments to the entire balance sheet (assets and liabilities) in order to reflect the economic value of the balance sheet. Typical adjustments include revaluation (mark-to-market) of investments, considering non-operating assets, etc. Please note, and this is very important, that the adjustments made differ for book value calculations vs. replacement asset value calculations! Below is a short list of (typical) asset adjustments: - Marketable securities and short-term investments - determine present market value by marking to market
- Accounts receivable - adjust to net realizable value (book value) or economic value (replacement asset value), e.g. bad debt allowance must either be netted or added
- Inventory consist of raw material, work in progress, and finished goods. If it will be sold in 12 months it will be included in current assets else non-current assets. Adjustments to inventory can be tricky, for instance, if the inventory control system is LIFO and prices are rising then a LIFO reserve (often as high as 20%) has to be added to the inventory asset. To determine any other adjustments to inventory the analyst must determine whether inventory days have been increasing (i.e. inventory turning slower). If it has been increasing then inventory asset value has to be adjusted downward based on the following rules: more commodity type inventory should be adjusted down a little (e.g. down by 25% or 75% of the original value), unsalable inventory should be adjusted down more ( e.g. down by 50% or 50% of the original value), and specialized inventory should be adjusted down the most (e.g. down by 75% or 25% of the original value)
- In the case of replacement asset value prepaid accounts (like deferred taxes), to be 'turned into cash' or 'bartered' within the next 12 months, should be discounted to present value. Using a discount rate of 15% this yields a discount factor of (1/(1+15%)^1=86.95% (i.e. down by 13% or 87% of the original value). In the case of deferred tax assets, it should be offset against any deferred tax liability, and the remaining amount (either asset or liability) should be discounted to its present value (PV) by the appropriate discount rate
- Property, plant and equipment should be considered separately. In the case of a reproduction valuation the historical cost of the different categories of PPE (i.e. property, plant and equipment) have to be considered individually. Property could be estimated based on current market values (or rather fair market values). Plant and equipment could probably be reduced as a result of technical innovation constantly driving down prices (except if plant has recently been replaced)
- Goodwill, when referring to intangible assets used to create value for the firm such as product portfolio, special licenses, customer relationships, competitive advantage, intellectual property, and so on, will probably have to be adjusted upward in order to determine true asset value. However, be careful not to be too optimistic when calculating realistic asset replacement or economic value. It is often not possible to accurately calculate the value of these intangible assets, and here Prof. Bruce Greenwald suggest a shorthand, i.e. use a multiple of the selling, general, and administration (SGA) cost, in most cases between one and three years' worth
- Capitalization of R&D expenses. Often companies expense R&D costs on an annual basis. However, these are actually assets of the company and have to be treated as such. I realize that most value investors shy away from companies with substantial R&D divisions and will therefore never be faced with having to consider capitalizing R&D. For completeness sake, and for situations where needed, I will briefly explain the process here. To capitalize R&D assets we have to start by considering how long it takes, on average, for it to be converted into commercial products. We can take here, as example, five years, which I will consider to be the amortization duration for the asset. Next I have to collect the cost of the expense over the past years ranging back to the amortizable life of the R&D asset. If this cost was uniform then I can calculate the value of the asset as the proportionate sum of the expense over the last five (I chose five as an example) as 1/5 of the cost 5 years ago plus 2/5 of the cost 4 years ago plus 3/5 of the cost 3 years ago plus ... and this years entire R&D expense to arrive at the value of the R&D asset (these are the unamortized amounts of the asset left if assumed that the lifetime is 5 years and the amortization process is linear across the lifetime, which yields 20% per year over 5 years). The effect of book value of equity is therefore: adjusted book value of equity = book value of equity + value of R&D asset. There is however an additional element to consider, and this impacts the Income Statement. The operating income has to be adjusted to consider amortization of the asset instead of the R&D expense. Adjusted operating income = Operating income + R&D expense - Amortization of R&D asset.
- Other adjustments. There are other adjustments than can be made, e.g. financing subsidiaries (e.g. BMW financial services), non-consolidated subsidiaries, prepaid pension assets, etc. These assets must be approached with caution and any adjustments must be carefully considered. In case of doubt, be very conservative and either exclude from the balance sheet or show at low values. In cases where operating expenses (or one of expenses) are capitalized as assets (and subsequent adjustments) care is needed to consider whether the adjustment has a pre-tax or post-tax effect on the Income Statement. Capitalization of pre-tax expenses, like R&D expense, is entirely tax-deductible and therefore no more adjustments are needed. Some companies, like Coca-Cola, could consider capitalize advertising spend because one can argue that it contributed to their brand value. Other companies, like consulting houses, could consider capitalizing recruitment and training fees of their most valuable assets, i.e. people. Amazon could capitalize SGA costs arguing that these expense contribute to brand value and help bring in new long-term customers.
What we are trying to achieve with these adjustments is to be "approximately right rather than precisely wrong". I acknowledge that to value an asset with 100% accuracy is very unlikely, but it is possible to value it within an acceptable margin of safety. These adjustments can be tricky and would be happy to answer any questions about them. Feel free to contact me and I will gladly provide examples and explain them as well. Next Steps (...next posts)
Next I will look at some of the other Balance Sheet items (Liabilities and Equity) and then move on to the Income Statement (for the Earnings Power value) and then the growth assets (for the Discounted Cash Flow valuations).
Please send me your comments or questions. I look forward to hearing from you.
Be Extraordinary!
Myles Rennie
Valuation Basics - The Financial Statements 2 In this post I continue to look at the balance sheet, but now I will consider liabilities and equity. Balance Sheet
In the previous post I discussed elements pertaining to the assets on the balance sheet. In this post I will focus on liabilities and equity.
Liabilities
Liabilities are also classified into current and non-current liabilities. Similar to assets, current liabilities are defined as anything that will have to be settled (paid) within 12 months. All other liabilities are non-current liabilities.
Equity
Typical Liability AdjustmentsAs mentioned in The Financial Statements 1 performing either book value, replacement value, or liquidation value revaluations requires adjustments to the entire balance sheet (assets and liabilities) in order to reflect the economic value of the balance sheet. Being a value investor makes me a conservative investor. Therefore, I don't like to fiddle with liabilities much and take a very conservative approach to making any adjustments. Below is a short list of (typical) liability adjustments: - I accept any prepaid expenses at book value
- Leases
- Options
As mentioned before, I approach adjustment to try and ensure that I am "approximately right rather than precisely wrong". These adjustments can be tricky and would be happy to answer any questions about them. Feel free to contact me and I will gladly provide examples and explain them as well. Net Asset Value or Book ValueFinally, we get to the valuation discussion. I have been working toward this point to allow the user to perform an asset valuation. With an adjusted balance sheet the process of determining the Net Asset Value (NAV) or Book Value (BV) is simple. You subtract the adjusted Liabilities from the adjusted Assets, which leaves you with the NAV. If you take this value and divide it by the diluted number of shares you have the NAV or (better known) BV per share. BV can be used for many different purposes. For instance, from here you can calculate the Price-to-Book ratio by dividing the current market price per share by the book value per share. This is an important ratio for value investors as we like to focus on companies with low price-to-book values. Price-to-book is so important that Benjamin Graham used it in the following manner: - Price-to-book ratio sets the floor for a stock price (if price-to-book was calculated using liquidation assumptions then under worst case scenario this ratio indicates how much of your investment you will recover)
- Higher price-to-book ratio's indicate greater risk during liquidation (i.e. the less likely there will be enough assets to pay all the debts and have money left for shareholders)
- If price-to-book ratio's move or become much higher than reasonable (or normal) for a particular stock or industry it could be a signal to sell (if an alternative investment, promising better returns, is available or if something fundamental in the business has shifted and requires exit)
- Inspect and screen out companies that don't have stable and growing yearly book values per share. Book value per share, as Buffett says, is the proxy he uses for determining intrinsic value per share. He considers it so important that he measures himself and Charlie Mungers' performance at Berkshire Hathaway in terms of yearly increasing book value per share (as reported in Berkshire's annual report - usually on page 2 of the annual report!)
- He screened out any stock which had a Price-to-book ratio, multiplied by Price-to-EPS ratio, of more than 22. Graham called it his Price-to-book test.
My aim here was to calculate book value per share (of the existing assets and ignoring any growth assets), which we have finally achieved. I have also briefly touched on some important aspects of book value (i.e. using price-to-book value as an example). There is much more to be said on understanding various ratio's (especially when screening possible investments or when performing a relative valuation). In a follow-up series of posts I could stop to discuss these. Book value seems to become very important overnight when times are hard (I wonder why...!?). I use book value per share as an indication of intrinsic value per share (see value continuum to understand where book value fits in) when considering whether to buy a share at a given market price. Therefore, I like quality companies trading at low price-to-book values, e.g. an established company with a durable competitive advantage, good management and a price-to-book ratio of close to 1 is fantastic! I consider anything near 1 and up to 1.5 or 1.6 very acceptable. I should however also warn against the weaknesses of book value. For industrial companies with fixed assets book value provides good insights. For companies in the service industry (e.g. consulting firms) business book value could be misleading. Due to relatively small asset base they will typically trade at higher price-to-book values. Value investors who has a circle of competence in this area, and invest in it, will have to adjust their screening criteria to consider these higher ratios. Also, companies growing fast will have higher than average price-to-book ratios and again the value investor focusing on companies in this phase of their business life-cycle will adjust their valuation criteria to consider this. Next Steps (...next posts)
Next I will look at the Income Statement and Earnings Power Value. Once this is done I will review the growth assets and the two Discounted Cash Flow (DCF) valuations starting from respectively Free Cash Flow to Firm and Free Cash Flow to Equity holders. Once done we will have all three intrinsic value estimates for a firm, i.e. the asset value, earnings power value and growth values.
Please send me your comments or questions. I look forward to hearing from you.
Be Extraordinary!
Myles Rennie
Valuation Basics - Putting the Financial Statements together This post puts together the previous discussing valuations and the financial statements. Therefore, to understand where are how this post first in you should read the proceeding posts please. The Valuation Process
To start off I will talk about the truth of valuation. Firstly, all valuations are biased. No one starts with a blank sheet and we all approach valuation with our own views before even starting, e.g. it starts with the companies we choose to value. With professional analysts there are institutional factors that create bias, e.g. herding, window dressing, etc. The inputs to your valuations reflect your optimistic or pessimistic position, e.g. loss aversion, lotteries, etc. Then there is the post valuation garnishing's
Most valuations (even good ones) are wrong. We expect to get the right answer when we follow the right steps. While this is true in baking and science, it is not the case in valuation. Even if your data sources are impeccable, they have to be converted into forecasts.
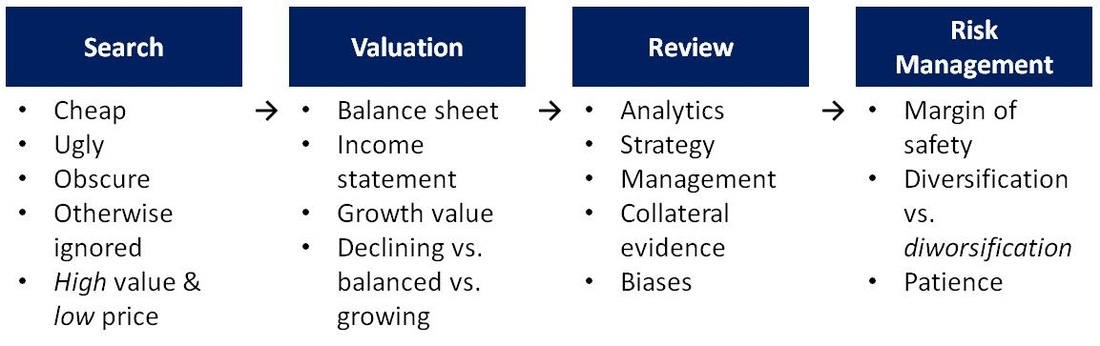
In order to find (screen) and evaluate investments stocks I use the process described below. Finding value investments takes a lot of time and effort. At Richland IH we use Validea to help us screen our possible investment candidates. Once Validea shows me possible candidates I start using the process above. The Value Continuum
Putting the Balance Sheet (existing assets), Income Statement (earnings power), and growth assets together allows me to define the value continuum (see figure below). The first valuation I posted on this site, i.e. the one done on Bowler Metcalf Ltd, demonstrated this continuum perfectly.
In Bowler's case the asset value was consistently less than the earnings power value which, in turn, was less than the growth value. As explained in the analysis, this is a sign of a firm with a durable competitive advantage, i.e. the kind of firm a value investor loves to invest in all else being equal.
These three intrinsic value calculations will always form the basis of my firm valuations. Once intrinsic value has been determined the true value investor will only make purchases only at prices far enough below intrinsic value to provide a margin of safety that would offer appropriate protection against the variance in the different valuations.
Please Note - DCF (growth value) Equity versus Firm Valuation
When valuing a business (using a Discounted Cash Flow approach) there are two ways which we can approach it. The first is to value the entire business, both assets in place and the growth assets. This uses the Free Cash Flow to Firm, and Weighted Average Cost of Capital, generated by the business in the DCF and this is called the enterprise value. The second method is to value the equity in the business. This uses the Free Cash Flow to Equity, and Cost of Equity, generated by the business in the DCF and is called the equity valuation. These two values are tied to each other and the net difference between the two is the value of any cash & marketable securities and net debt position of the business.
When I perform a growth intrinsic value calculation I do both (equity value and firm value) just to make sure I have not done something wrong. These two figures are never exactly the same, but they are usually close enough not to make a difference and that's good enough for valuation purposes.
I will not delve into more of the detail here. I will spend more time in a follow-up post to provide more detail. I hope this brief overview has provided you with some insights into the financial statements and how they are used to help you understand intrinsic value.
There is so much more to add to this subject, just consider the hundreds (or thousands) of books available on this subject and the importance to the economy and our lives in general. I want to write much more on this matter and I will add ideas and special posts in future on this subject. I will try and pick topics and ideas that are specific to value investors in order to help them make better investment decisions.
Please send me your comments or questions. I look forward to hearing from you.
Be Extraordinary!
Myles Rennie
 At Richland IH we are continuously valuing listed common equities in order to identify great value investment opportunities for us and our investment partners. We have a steadily growing capital base and list of investment partners keen to understand and learn how to create sustainable wealth over the long term. At Richland we follow very clear investment identification guidelines as laid out by Benjamin Graham and Warren Buffett (discussed in some of the posts below). Additional to their philosophies I have added my own valuation criteria over time to ensure that we protect the principle of our investment partners to our best ability. Benjamin Graham defined an investment operation as: "one which, upon thorough analysis, promises safety of principal and an adequate return. Operations not meeting these requirements are speculative." Therefore, all investments made at Richland follow this thinking. Following Graham and Buffett there are four major criteria that any investment has to comply with: - It should be a simple business to understand within my circle of competence
- It should have good management in place
- It should have a sustainable or durable competitive advantage
- It should have favourable economics
These four main criteria set the stage for the valuation process that I follow. Some of these criteria are qualitative and some quantitative. The first three criteria can be grouped into what I term the Phase I valuation, i.e. is this a company I would like to invest in?. The last criteria falls into Phase II of my valuation, i.e. should I buy based on the economics and current market price?. Note that I will focus here more on the quantitative analysis, and therefore start from point three onward (i.e. it should have a sustainable or durable competitive advantage).
Phase I: is this a company I want to invest in? I will start my valuation of Bowler Metcalf Ltd (ticker symbol: BCF), a company that we follow and invest in at Richland IH, by examining the stability and competitiveness of BCF. The very first criteria I look at it stability in both Earnings per Share and Sales per Share (see figure below).
Stability and Growth of EPS and SPS of the business
The figure shows the EPS and SPS over the last 8 reported full year results. I like companies to have solid, stable earnings and sales that are continually expanding. This allows me to accurately (as far as possible) predict future earnings and sales.
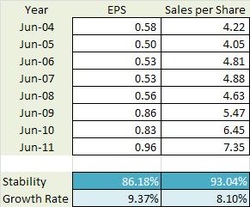 I measure the stability or consistency of the growth of historical earnings per share from year to year, expressed as a percentage in the range 0 to 100 percent. High stability percentage corresponds to high stability and low stability percentage corresponds to low stability. Stability of 100 percent signifies complete stability, meaning that the data is changing by exactly the same percentage each year. The function I developed to calculate the stability percentage has the feature of adjusting for data that could overly distort the result, such as one-off extreme data points, negative data, and data near zero. It also puts more emphasis on recent data.
BCFs EPS stability is 86% which indicates a high level of stability given that we have just come through the biggest world-wide recession of the last 80 years. BCFs sales per share stability is even higher at 93% indicating that even during the recession, the sales activity continued to be stable.
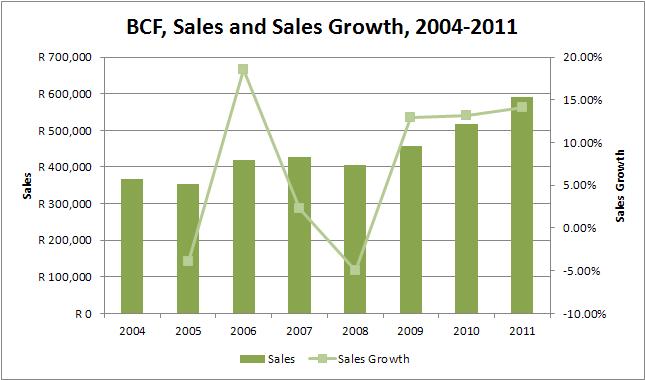
Next we consider the 8 year growth rate of both EPS and SPS. The function I developed to calculate the historical growth rate does not simply calculate either the average or compound growth rate of the 8 years, it considers the annual growth rate year on year. It shows that EPS grew by 9.37% year on year wheres the SPS grew slightly lower at 8.10% per year. Both the EPS and SPS grew at rates higher than the average South African medium-term inflation rate (roughly 6%).
The high stability scores, as well as the growth rates higher than medium-term inflation rates, are the first indicators that BCF has a durable competitive advantage. The figures below show respectively EPS vs. EPS Growth and SPS vs. SPS Growth for BCF.
I particularly look for stocks that have stability percentages of 80 percent or more for both their earnings and their sales. If a company does not satisfy this criterion, I usually just pass it by. After all, if there was little stability in sales and earnings in the past, then it becomes virtually impossible to make confident forecasts for the future.
BCF pass this criteria. Average ROE and ROIC of the business
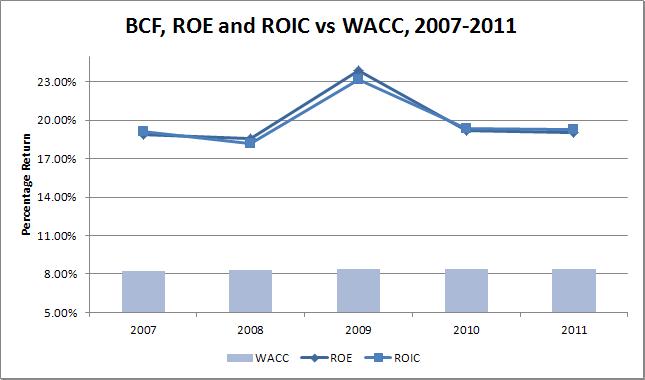
I like companies with above average Return on Equity (ROE) of at least 18% or better, as this is another indicator that the company has a durable competitive advantage. Because some companies can be financed with debt that is many times their equity, they can show a consistently high ROE, yet still be in unattractive price competitive businesses. To screen out these companies I consider a companies Return on Invested Capital (ROIC), which must be higher than 15% and it must be higher than the Weighted Average Cost of Capital (WACC) of the company. | | If a company that can maintain its ROIC consistently above its WACC is creating value for its shareholders. A company that has a ROIC lower than its WACC, irrespective of the rate of growth of the company, is destroying value. In fact, when ROIC is smaller than WACC, then the faster the company grows the faster it is destroying value! | Calculating the WACC of a business could be a complex task. There are many different ways of calculating the Cost of Equity and the Cost of Debt of a business. The calculations for BCFs WACC is not displayed here, but if required please email me (see the contact me form) and I will gladly supply the calculations (and the thinking). Suffice it to say, that with a BETA of between -0.01 and 0.01 one can assume that BCFs WACC should be very close to the South African Risk Free Rate (which I assume, most of the time, to be 8.5%).
BCFs average ROE over the last five years was 19.9% and its average ROIC over the same period was 19.83%. The average ROE is higher than the required 18% and the average ROIC is higher than the required 15%. Furthermore, the ROIC is much higher than the average WACC of 8.36%. Therefore, management is creating value for shareholders at a good pace.
The consistently high ROE and ROIC rates is the second indicator that BCF has a durable competitive advantage.
BCF pass this criteria. Corporate Stability of the business
I like companies that demonstrate a high level of corporate stability over the long term. The functions I have developed to measure corporate stability consider a number of different financial ratio's of a firm to determine a stability score. A high corporate stability score is required before considering any investment in the company.
| | A score above 8.15 indicates little chance of the business failing based on current management principles. The average stability score for BCF over the last five years has been 11.54 which is much higher than the required 8.15 for a very stable company. | This is the kind of company I like to invest in, because it has a good chance of still doing what it is doing, and being in business, 10 years from now. BCF is the kind of business I can invest in and forget about, come back in ten years, and it is still going strong.
The consistently stability score is the third indicator that BCF has a durable competitive advantage.
BCF pass this criteria.
Capital expenditure of the business
I like companies that do not have major capital expenditures, i.e. I look for companies that do not need to spend a lot of money on major upgrades of plant and equipment or on research and development to stay competitive.
BCFs free cash flow per share of 57, 90, 105, 69 cents over the past four years are all positive, indicating that the company is generating more cash that it is consuming. This is a favorable sign, and so the company passes this criterion.
BCF pass this criteria.
Debt position of the business
I like businesses that are conservatively financed. Nonetheless, I am willing to invest in firm with solid bond ratings. In South Africa it is not always easy to obtain a bond rating for a firm, and therefore I have developed functions that calculate a synthetic bond rating based on the fundamentals of the business. BCFs synthetic bond rating is calculated as "AAA" based on both its corporate stability rating and the fact that its interest cover ratio is very, very high. In fact, BCF shows R16 500 000 of debt on its balance sheet (31 June 2011), and earnings of R 77 000 000 (31 June 2011). Therefore, it is able to take some of its R77m profit and pay off its debts in one go if it has to, which is considered exceptional.
BCF pass this criteria. Use of Retained Earnings by the business
This is one of Buffett's main screening criteria, and I love it was well. Buffett likes to see if management has spent retained earnings in a way that benefits shareholders. To determine this, Buffett takes the total amount of retained earnings over the previous eight years of R 4.14 per share and compares it to the gain in EPS over the same period of 37.9 cents. BCFs management has proven it can earn shareholders a 9.16% return on the earnings they kept.
This return is average, and slightly higher than the South African Risk Free Rate. Essentially, management is doing a OK job putting the retained earnings to work, but by no means a fantastic job.
BCF has a No Fail on this criteria, but it is not a pass.
This concludes the quantitative elements of the Phase I valuation. Next the valuation moves to Phase II. Phase II: should I buy based on the economics?
If and when I get positive responses to all the above criteria, I then proceed with a value vs. price analysis. The value analysis will determine whether or not the stock should be bought. The following is how I evaluate BCF quantitatively.
I start by understanding the intrinsic value of the business from the perspective of the Balance Sheet, Income Statement, and finally the Free Cash Flow. Intrinsic Value of the business - Balance Sheet
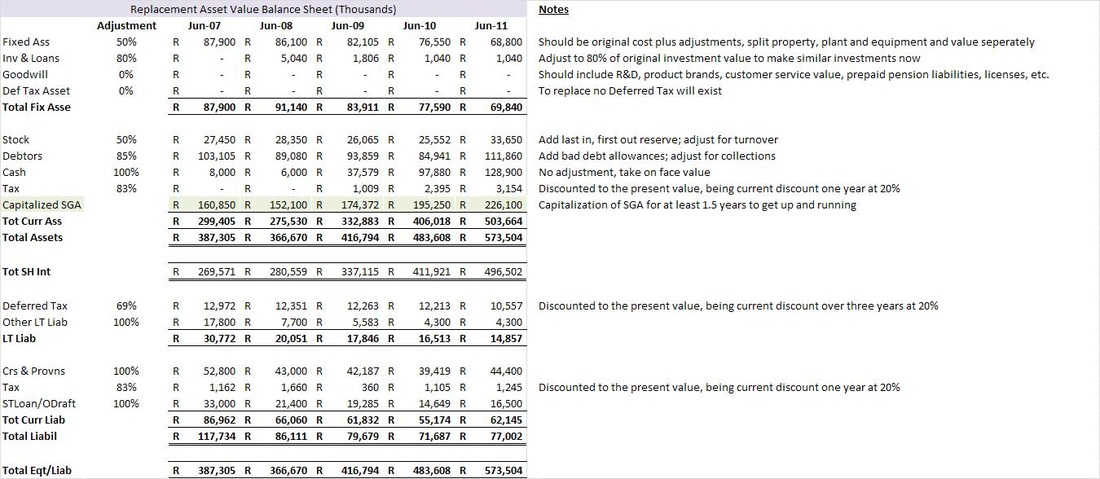
The first step in a Graham valuation is to calculate the asset value of the firm. Many (traditional) value investors see this as the only step to follow. I like to calculate the Asset Replacement Value for the firm. In BCFs case I started with the actual Balance Sheet (BS) for the last five years. Each of the rows in the BS is adjusted by the factor to produce the replacement BS.
The Adjustment column shows the percentage adjustment made for each line item from the original published BS. The Notes column at the end shows why an adjustment was made for an item. The Tot SH Int row shows the Adjusted Book Value for BCF for the years displayed. On a per share basis the Adjusted Book Value per Share is 308, 321, 403, 513, 617 (all values in cents) with each value corresponding to the year 2007 to 2011. This is my intrinsic Balance Sheet values for BCF. Intrinsic Value of the business - Income Statement
Understanding the value of the business from the Income Statements (IS) perspective helps me to understand how hard BCFs management is sweating their assets, i.e. are they managing to grind their assets harder in order to make good returns with the assets they own. I start by looking at BCFs Return on Assets (ROA). BCFs annual ROA over the last five years was 12.58%, 13.78%, 18.65%, 15.68%, 15.83% with an average of 15.30%. This shows that BCF has been able to work their assets hard.
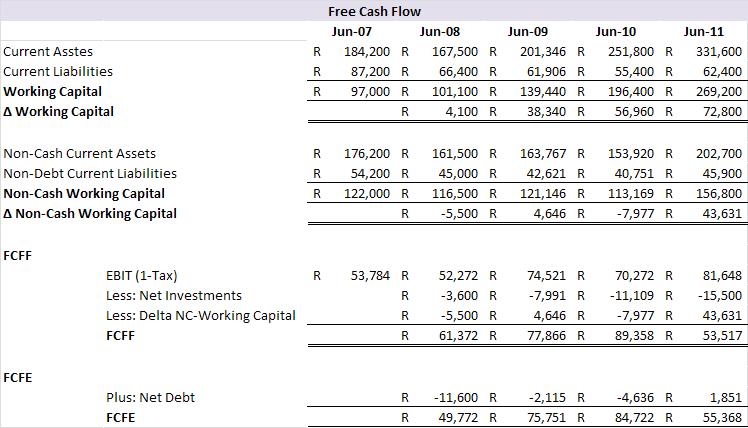
The free cash flow calculations indicate positive free cash flow to both Firm and Equity holders for the last five years. To understand, from the perspective of a value investor, the Earnings Power Value (EPV) of the business, I start by taking the Free Cash Flow to Equity Holders (FCFE) and capitalizing it by the cost of equity (if I worked with the Free Cash Flow to the Firm I would have used to WACC to capitalize the free cash flow).
Calculating the BCFs EPV yields 673, 1071, 1248, 814 cents per share with each value corresponding to the year 2008 to 2011. This is my intrinsic Income Statement values for BCF.
Intrinsic Growth Value of the business - Discounted Cash Flow (DCF)
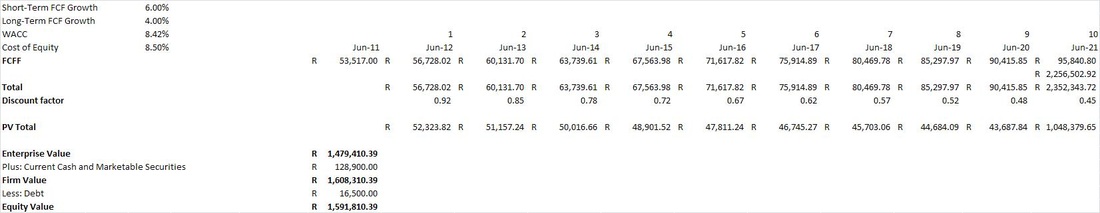
Most value investors don't even attempt to perform a DCF valuation. I do it to see what the possible, yet conservative, upside value of the business could be. Therefore, a DCF of BCF gives me the top or maximum intrinsic value per share. The figure below shows the DCF performed for BCF. I assumed higher growth for the next ten years (very conservative at 6% per year) with a long-term growth rate of 4%. I used the forward-looking WACC to calculate the discount rates.
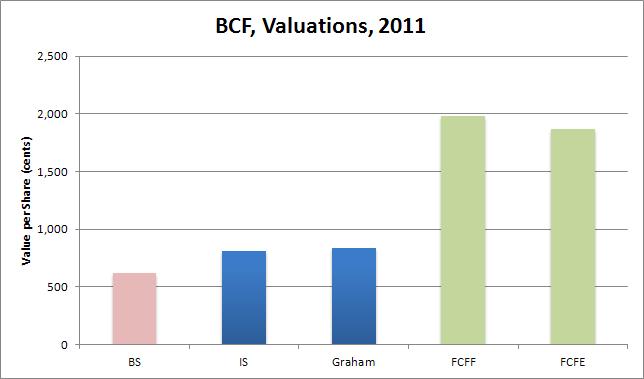
At the bottom of the figure the Enterprise, Firm and Equity value of BCF is displayed. Based on the Equity value calculated the intrinsic value per share is calculated at 1978 cents. When I perform the DCF but starting from the FCFE perspective, I obtain an intrinsic value of 1866 cents per share. These numbers should be the same, and I can accept in this case that they are sufficiently close together to show that the calculations are sound. Intrinsic Value - putting it all together
From the exercise above we have obtained three different values for BCF. I usually also do a Graham Valuation as described in Chapter 39 of his 1962 Security Analysis. The value (which is based on earnings) is calculated for BCF using Graham's approach and is shown in as the middle bar in the graph below. Note that BS shows the Replacement Asset intrinsic value. IS shows the Earnings Power Value. FCFF and FCFE respectively show the DCF value form the perspective of mentioned. What is important to note in this graph is that BS is less than IS and BS is also less than Graham. This is the fourth and final indicator that the business enjoys a durable competitive advantage. Furthermore, IS and Graham are both less that the valuation considering growth, i.e. FCFF and FCFE. The bars in this chart show the classic style of a company with a durable competitive advantage: they sweat their assets very hard and therefore have a consistent gap between asset values and earnings values. This graph only shows the valuations for 2011, but in my analysis this gap is positive for the last five years.
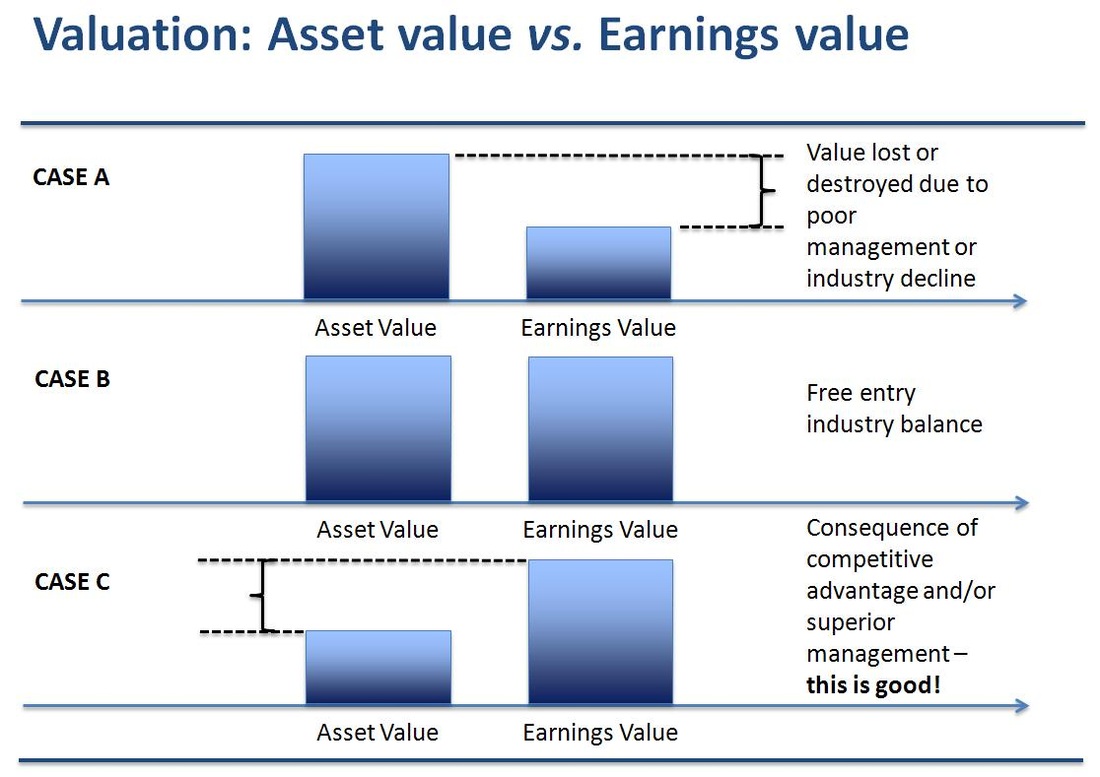
Prof. Bruce Greenwald, in his book Value Investing: From Graham to Buffett and Beyond, defines the details of the relationship between asset value (BS) and earnings power value (IS and Graham) and how this, if the relationship is consistent, is an indication that the firm has durable competitive advantage (see the figure below for simple explanation). Based on the analysis above a fair price to pay for BCF (at the end of June 2011) would be somewhere near R 8.50 per share. Paying more than that would imply paying for potential growth, not something a value investor likes to do. To be honest, a value investor likes to buy assets at a discount (and so do I). Therefore, a value investors buy price would be 75% of the fair value: R 6.38 = R 8.50 x 75%.
In order to make the final investment decision I have to consider what my potential return on investment (ROI) could be if I bought at either R 6.38 and R 8.50. In order to do that I have to determine what the possible future share price could be in 10 years time, using the information I have already gathered and analysed on BCF.
Based on valuations what is the expected return in 10 years?
The final step in the valuation is to determine what the expected share price value could be in 10 years time given the current book value, earnings per share (EPS), payout ratio, P/E ratio, and EPS growth rate. I perform two calculations to determine the possible future share price. The first method starts from the perspective of ROE and the second starts from EPS.
The ROE method starts by determining the average payout ratio. I calculated it as 24.04%. I calculated the average ROE for BCF as 19.90%. This provides the average ROE after payout at 15.11%. Using this as an estimated equity growth rate (based on the relationship to estimate fundamental growth rates = Retention Ratio x ROE) I calculate the equity per share in 10 years to be R 20.69. This yields, given the average ROE, EPS in 10 years of R 4.12. I then calculate the expected price per share in 10 years (using the average P/E over the last 8 years) as R 39.95. Note that to calculate the final share price I add the cumulative expected dividend per share for the 10 future years. Finally, I calculate the expected compound growth rate between R 8.50 (current share price) and R 39.95 (possible future share price in 10 years) as 16.74%. If, however, I calculate the compound annual growth rate between R 6.38 (the margin-of-safety buy price) and R 39.95 it yields 20.13% return.
The second method starts by estimating the future EPS in 10 years using the EPS growth rate calculated earlier. This yields EPS in 10 years of R 2.36. Using this estimated EPS I calculate the possible future share price as R 24.55 (using a similar method as described in the paragraph above). Finally, I calculate the expected compound growth rate between R 8.50 (current share price) and R 24.55 (possible future share price in 10 years) as 11.19%. If, however, I calculate the compound annual growth rate between R 6.38 (the margin-of-safety buy price) and R 24.55 it yields 14.43% return. Interpreting the resultsThe final step is to review the results. Based on my calculations I can show the following: - buying BCF at R 8.50 could yield a possible return of between 16.74% and 11.19%, with an average of 13.96%. This presents a good investment opportunity.
- buying BCF at R 6.39 could yield a possible return of between 20.13% and 14.43%, with an average of 17.28%. This presents a great investment opportunity.
BCF is a good buy. It passes all the key criteria and even buying at fair value still presents good investment opportunities. However, buying at the margin of safety price provides true value investor returns. Buffett managed to secure 20%-plus compounded annual returns over more than 40 years by buying at the right price and sticking to his strategy. My recommendation therefore is to buy BCF at prices from R 8.50 and below.
I would suggest buying BCF at prices from R 8.50 and below. I would not pay more than R 8.50 per share for BCF due to the declining expected future return.
I hope you have enjoyed this first valuation exercise. This is the first of many and will try and post one every couple of weeks. I plan to adjust, or add to, some of my investment criteria with following posts. I also plan to elaborate on the thinking behind the investment criteria with follow-up posts. This will allow people following these posts to gain an understanding of my thinking.
Please feel free to contact me in case you have any additional questions or suggestions regarding the valuation.
Be extraordinary!
Myles Rennie
P.S. The above analysis should not be considered investment advice. I will not be held liable for any investment decisions, or investments, made based on my analysis.
|
 RSS Feed