To all Value Investors
I am a Value Investor with an interest to understand the market, invest in extraordinary businesses, and grow wealth. The main tool I use to share my value investing ideas is my value investing blog. I believe value investing is about Mind, Method and Money and I live, learn, and love (i.e. own) as many elements and traits of value investing, and successful value investors around the world, as I can in order to achieve my personal and investment goals.
Below are some other elements of investing and markets that interest me, e.g. technical analysis and market trends, which I use in various ways to help me better understand the markets and ruling market emotions. Below is one of the tools I have developed, a Fear & Greed Index for the JSE All Share. I plan to add additional tools over time to this site.
Below are some other elements of investing and markets that interest me, e.g. technical analysis and market trends, which I use in various ways to help me better understand the markets and ruling market emotions. Below is one of the tools I have developed, a Fear & Greed Index for the JSE All Share. I plan to add additional tools over time to this site.
Myles Rennie JSE All Share Fear & Greed Index
As a value investor the emotions of fear and greed are important to me, specifically to understand the current market sentiment, i.e. as either fearful or greedy. Warren Buffett teaches value investors to be greedy when others are fearful and fearful when others are greedy. Therefore, I have created a Fear & Greed index for the Johannesburg Stock Exchange (JSE) All Share Index (JSE:ALSH), which I update once a week, to track the overall market emotional index. This index helps me make more informed investment decisions and helps me better manage and advise investments for the Richland IH equities portfolio.
Please note that this is a new feature (BETA) and therefore subject to change and data errors. The charts are for information purposes only. Even though I use it, I do not recommend the Fear & Greed Index should not be used to base any investment decisions on.
Please note that this is a new feature (BETA) and therefore subject to change and data errors. The charts are for information purposes only. Even though I use it, I do not recommend the Fear & Greed Index should not be used to base any investment decisions on.
|
|
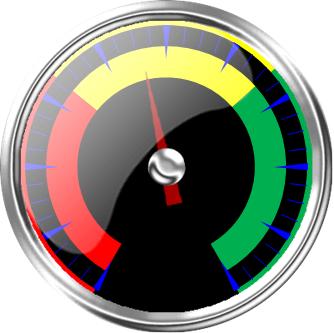
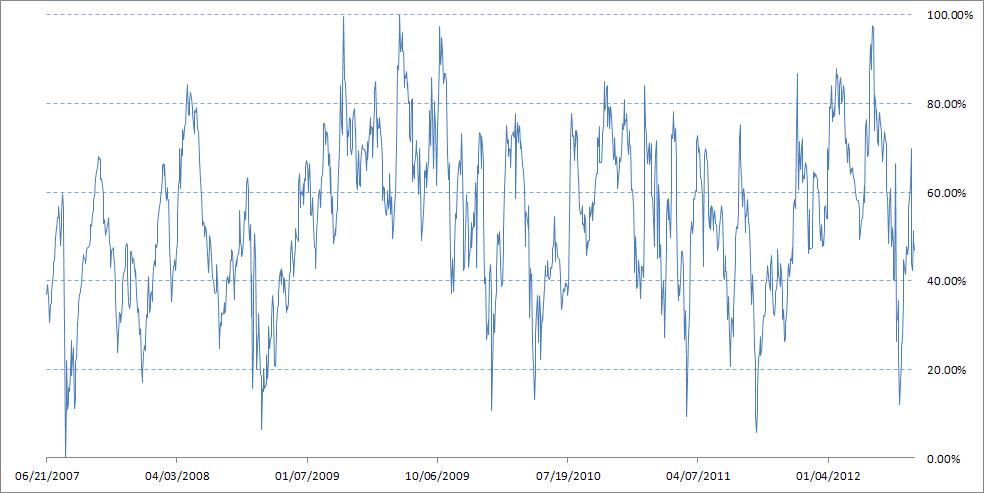
Fear & Greed Index BETA
|
|
The average of the market momentum and volatility deviation measures are currently 45.90%. This is an indication that the market emotion is Slightly Fearful.
|
Updated by Myles Rennie
02 July 2012
02 July 2012
Two Fear & Greed Indicators
The indicators used to calculate the index is shown below. I provide a quick guide on why I use them at the bottom of the page.
Market Momentum |
Slightly below Neutral toward Fear |
|
The JSE:ALSH is 0.60% below its 125-day average. During the last two years, the JSE:ALSH has been above this average much more often than not (278 days more above than below). A position like this indicate a level of slightly off neutral toward a growing market and greed.
Note that the 125-day EMA has is showing a increase pattern. Based on previous market movement cycles the 125-day EMA will likely remain relative flat for a month or two and then start a new, strong upward trend. The deviation graph shows that we are currently at about 45.06% with 50% exactly average. Therefore, market deviation is slightly down toward the fear emotion. |
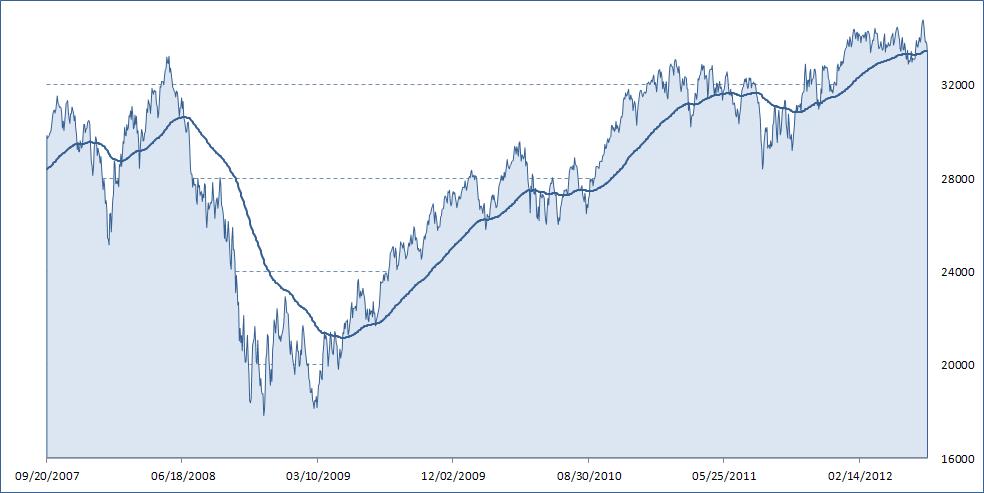
JSE All Share Moving Average - 125-day MA vs. Closing prices
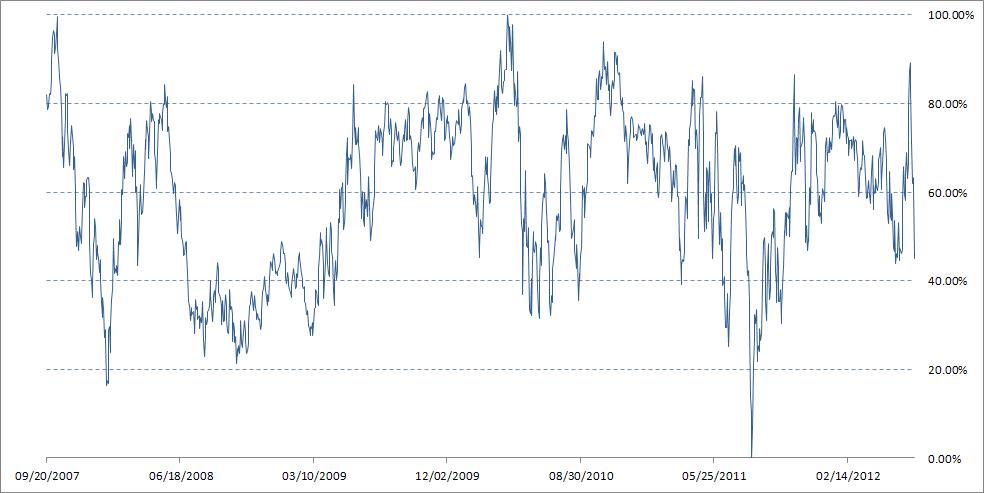
Relative deviation from the 125-day MA for the JSE All Share
|
South African Volatility Index (SAVI) |
Slightly below Neutral toward Fear |
|
The Volatility Index is currently above the average and is indicating slight volatility. The Volatility Index (SAVI) is at 22.73, 1.66% above its 50-day moving average and indicates that investors concerns about the near-term values of their portfolios are stable.
The deviation graph shows that we are currently at about 46.75%, with 50% exactly average. Therefore, the SAVI deviation is shows an almost neutral view. The deviation is measured as a percentage offset from the average offset from the 50-day EMA. |
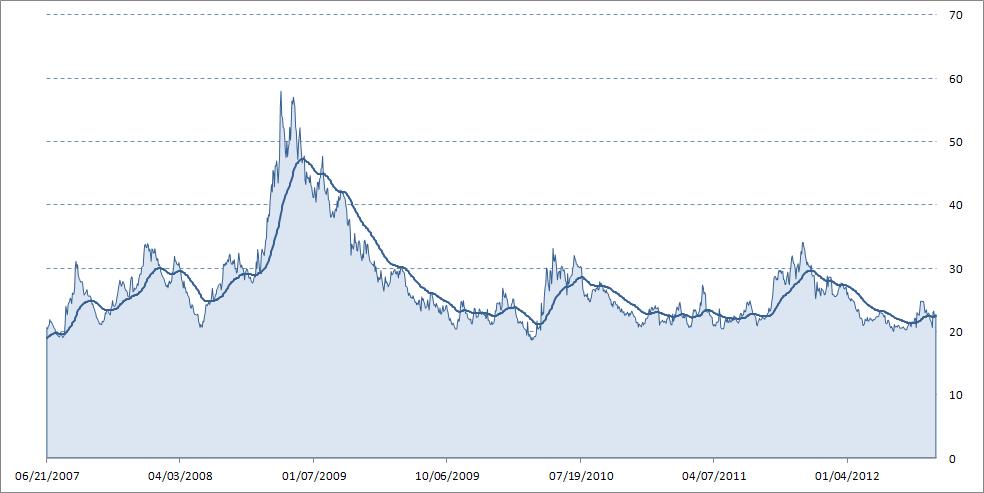
SAVI and its 50-day MA vs. Closing prices
Relative deviation from the 50-day MA for the SAVI
|
My JSE All Share Fear & Greed Over Time
The chart shows my JSE All Share Fear & Greed Index since January 2011.
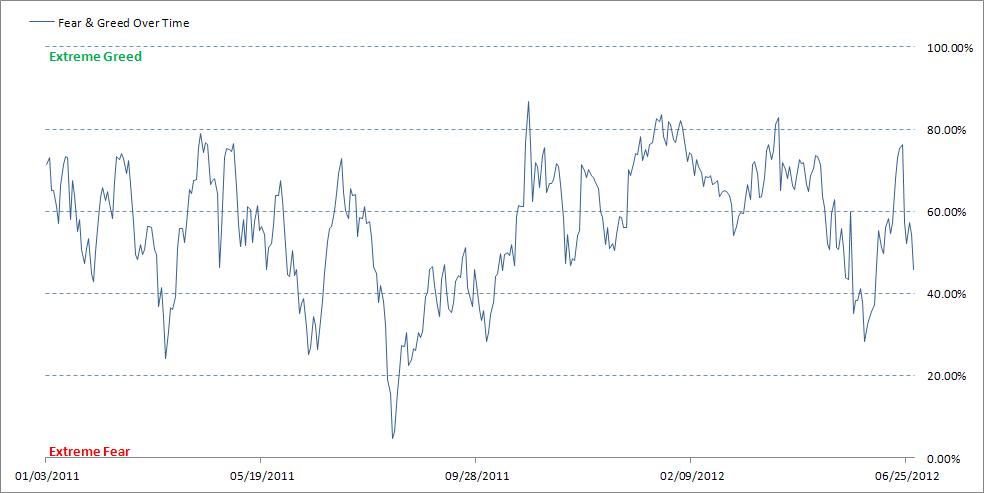
The index for the last 18 months show that during beginning of August last year the market was extremely fearful and toward end of January this year the market was greedy. It shows the market has been steadily becoming more fearful since January this year, and has fallen sharply since beginning of May 2012. Since the end of May 2012 the market has tipped toward the Greed side of the scale and hit 75%, which is at the cusp of extremely greedy, on 20 June 2012. Since then it has fallen back to 45%, which is on the fear side of the index.
The volatility in the market creates nervousness and uncertainty, which in turn creates opportunity for knowledgeable buyers willing to upload on good shares when others are fearful. Value investors should be looking in the market for great companies at low P/E and P/B ratios.
The volatility in the market creates nervousness and uncertainty, which in turn creates opportunity for knowledgeable buyers willing to upload on good shares when others are fearful. Value investors should be looking in the market for great companies at low P/E and P/B ratios.
Why use these underlying indices for the Fear & Greed Index
Why use 125-day Moving Average and Market Momentum?
The 125-day moving average is an indicator that tracks 'mean reversion', or the belief that prices, over time, tend to move back towards the average. The direction of the 125-day MA shows whether the moving average trend is rising, falling, flat or changing. Secondly, it shows whether the current price above, below or at its 125-day MA. Lastly, it shows whether the current price is diverting or reverting to its 125-day MA. The 125-day average is an indication of trading activity over the last 6 months and is a fairly 'long' indicator used by analysts.
The Market Momentum is a measure of the general direction and strength of a market’s trend over a period of time. The strength up or down is important to understand how fearful or greedy speculators currently are.
Why use the SAVI?
The SAVI, is not only a measure of the 3 month at-the-money volatility, but it is more precisely a measure of the 3 month at-the-money volatility adjusted for the contribution from the volatility skew (i.e., the volatility skew is the market’s expectation of a crash). Many people consider the SAVI as a 'fear' gauge for the market since the new SAVI (since 2009) incorporates a market crash protection volatility premium (or volatility skew).
Volatility is a measure of risk in the market. It can estimate how far prices move or, alternatively, how far they are expected to move in a given time frame. When volatility is low, there is a measure of complacency evident in the market and a lack of fear. High volatility, however, suggests a fearful market. In a high volatility environment, large market moves are possible, both up or down, and speculators and emotion drive prices in all directions.
The SAVI represents a forecast of asset return uncertainty over a 3 month period, i.e. uncertainty or expected risk about the future. Therefore, the SAVI allows my Fear & Greed index to incorporate a outlook of expected risk on the future, which in turn allows me as a value investor to perhaps hold back allocation of capital due to buying opportunities on the not-too-distant horizon.
Last Index Indicator - 13 June 2012
This section just shows the indicator as it was when last measured.
This section just shows the indicator as it was when last measured.

|
The average of the market momentum and volatility deviation measures are currently 51.11%. This is an indication that the market emotion is Neutral.
|
Summary
I am very excited about this new feature of my site and I plan to implement a couple of other things like this. It helps to simplify my life and helps me when making portfolio decisions for both myself and for Richland IH. At the same time I like sharing my thinking and putting it out there for everyone (and open myself to scrutiny). I hope you like it as well. Please let me know your thoughts and ideas!
I am very excited about this new feature of my site and I plan to implement a couple of other things like this. It helps to simplify my life and helps me when making portfolio decisions for both myself and for Richland IH. At the same time I like sharing my thinking and putting it out there for everyone (and open myself to scrutiny). I hope you like it as well. Please let me know your thoughts and ideas!
I hope you enjoy my writing and thinking as much I enjoy creating it.
Be Extraordinary!
Myles Rennie
Be Extraordinary!
Myles Rennie
