Please note, this is a screening valuation only. This is not a full fledged valuation of the subject shares and therefore should not be used as the final basis for any investment decision.
Prior to performing a detailed valuation on a business, as illustrated in the many examples below, I perform a ‘screening valuation’ of various businesses in order to determine where I should direct my detailed analysis effort. In order to screen businesses I focus on the following elements or numbers of the considered businesses:
• 10 years of Earnings per Share (EPS) data
• 10 years of deflated EPS data
• 10 years of ROE data
• analyst or consensus forecasted EPS growth rate, if available
• lowest P/E ratio over the last 5 to 10 years
• the average Retention Rate (RR) of the business
• the latest available Book Value per Share (BPS)
Using this set of data for each business considered I calculate a number of ratios and returns for each to help me identify potential value investment candidate businesses. Businesses that pass this initial screen will further be analyzed in detail. From the detailed (individual) analyses investment decisions will be made, i.e. the decision as to where investment capital will be allocated.
In this post I will be comparing 18 different value stocks as of 28 May 2012. The table below shows the final result of the analysis (I have excluded Mondi and Reinet's screens due to incompleteness of my analysis or incompleteness in the data available).
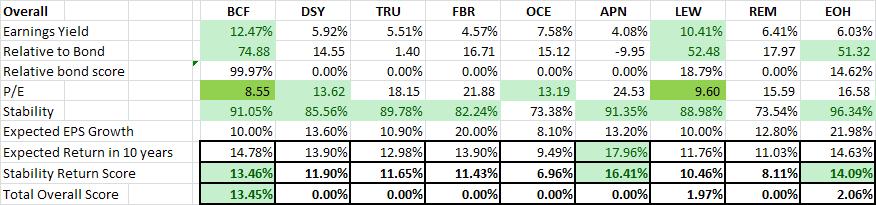
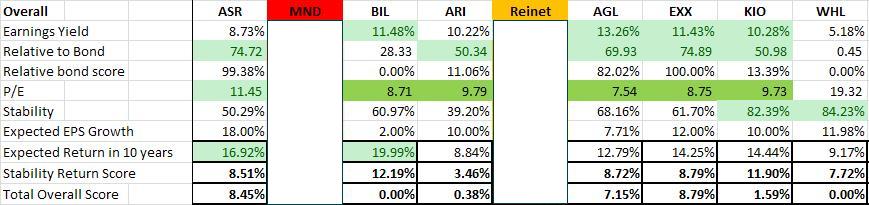
This table shows the result of my screening calculations (not shown in this post) and include 8 overall calculations. Below I have described some of them. They are:
- Relative to Bond Yield - I calculate the earnings for a share based on the latest earnings per share (EPS) and current share price (i.e. E/P). I then calculate the historical EPS growth rate and, combined with the analyst expected forecasted EPS, estimate the relative EPS for the next 10 years and possible relative share price in 10 years, if I invested R100 in this business today. I then compare this to the return of R100 invested in a 10 year South African government bond
- Stability Score - I calculate the stability in growth of both the historical EPS and historical Deflated EPS. The stability of growth of Earnings-, Sales- and Book Value per Share are vitally important for any value investor.
- Expected EPS Growth - the expected EPS growth is based on the historical growth rate and the analyst estimate. The expected EPS growth is very conservative to ensure that we rather under-promise and over-deliver than the alternative.
- Expected Return - the compounded annual rate of return is estimated using two different techniques. The first considers the EPS growth over the next 10 years and the second considers the growth in book value over the next 10 years. Both estimate the future share price from these numbers, includes the possible dividends over the next 10 years, and then calculates the expected compound annual return. As can be expected these approaches produce different results, and the final expected return is the average of the two results.
- Stability Return Score - we now come to the crux of the matter. I take the stability score and multiply it with the expected return. This gives me a stability return score, i.e. the expected return impaired for the stability (or instability) of the earnings history. The stability return score forms the basis of the decision whether to further investigate, i.e. perform a detailed analysis of, the business.
- Total Overall Score - I use the stability return score, multiplied by the relative bond score, to calculate the combined effect of the expected return and relative performance to a R100 10 year South African government bond.
My recommendations
I hope you have enjoyed this short valuation example. Based on the above I further analysed (in detail) BHP Billiton. Finally, after the detailed analysis of BHP and other current investment shares, I made my investment recommendations for Richland IH and we will allocate investment capital based on these decisions.
A word of warning to anyone contemplating investing in mining shares/commodities: this is a very specialized field and a tenet of any value investor is to remain within his or her circle of competence. Resources are very attractive to value (i.e. long-term) investors, i.e. the world population is growing and although growth in economies speed up and slow down the demand for commodities will just increase in years to come, who are willing to invest in companies with diversified and extensive resource basis (i.e. ore bodies in the ground), that have good management in place, have good distribution networks in place (especially in emerging and high growth markets), are willing to remain invested for the long-term, and fully understand the risks of holding commodity shares (i.e. if they have to sell during a commodity down cycle they will be punished for the decision - commodity companies are price takers not price makers).
Please feel free to contact me in case you have any additional questions or suggestions regarding this, or any other, valuation. Always remember to live every day to be a 105%'er ;)
Be Extraordinary!
Myles Rennie
P.S. The above analysis should not be considered investment advice. I will not be held liable for any investment decisions, or investments, made based on my analysis.
 RSS Feed