
At Richland IH we are continuously valuing listed common equities in order to identify great value investment opportunities for us and our investment partners. We have a steadily growing capital base and list of investment partners keen to understand and learn how to create sustainable wealth over the long term. At Richland we follow very clear investment identification guidelines as laid out by Benjamin Graham and Warren Buffett (discussed in some of the posts below). Additional to their philosophies I have added my own valuation criteria over time to ensure that we protect the principle of our investment partners to our best ability. Benjamin Graham defined an investment operation as: "one which, upon thorough analysis, promises safety of principal and an adequate return. Operations not meeting these requirements are speculative." Therefore, all investments made at Richland follow this thinking.
Following Graham and Buffett there are four major criteria that any investment has to comply with:
Following Graham and Buffett there are four major criteria that any investment has to comply with:
- It should be a simple business to understand within my circle of competence
- It should have good management in place
- It should have a sustainable or durable competitive advantage
- It should have favourable economics
Phase I: is this a company I want to invest in?
I will start my valuation of Bowler Metcalf Ltd (ticker symbol: BCF), a company that we follow and invest in at Richland IH, by examining the stability and competitiveness of BCF. The very first criteria I look at it stability in both Earnings per Share and Sales per Share (see figure below).
Stability and Growth of EPS and SPS of the business
The figure shows the EPS and SPS over the last 8 reported full year results. I like companies to have solid, stable earnings and sales that are continually expanding. This allows me to accurately (as far as possible) predict future earnings and sales.
The figure shows the EPS and SPS over the last 8 reported full year results. I like companies to have solid, stable earnings and sales that are continually expanding. This allows me to accurately (as far as possible) predict future earnings and sales.
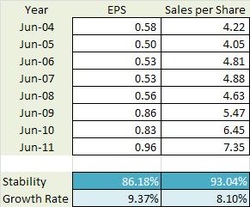
I measure the stability or consistency of the growth of historical earnings per share from year to year, expressed as a percentage in the range 0 to 100 percent. High stability percentage corresponds to high stability and low stability percentage corresponds to low stability. Stability of 100 percent signifies complete stability, meaning that the data is changing by exactly the same percentage each year. The function I developed to calculate the stability percentage has the feature of adjusting for data that could overly distort the result, such as one-off extreme data points, negative data, and data near zero. It also puts more emphasis on recent data.
BCFs EPS stability is 86% which indicates a high level of stability given that we have just come through the biggest world-wide recession of the last 80 years. BCFs sales per share stability is even higher at 93% indicating that even during the recession, the sales activity continued to be stable.
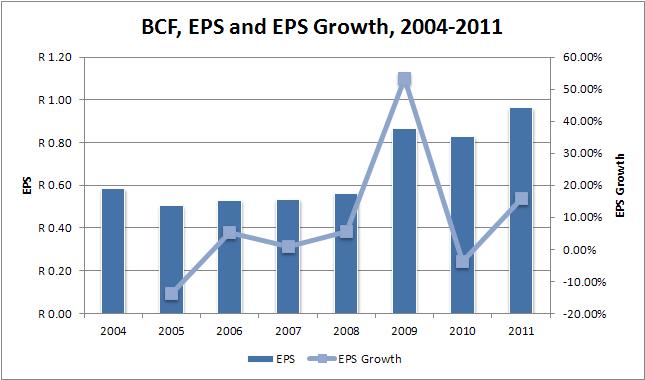
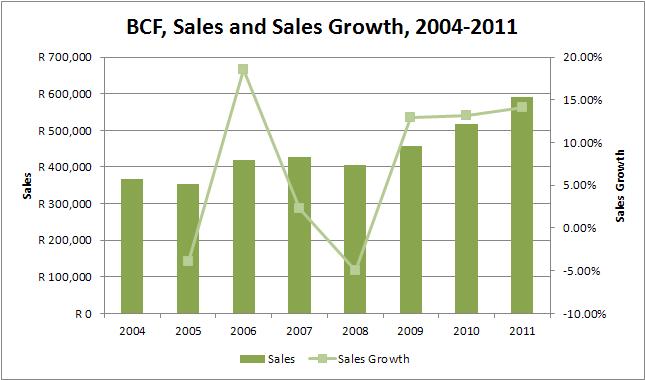
Next we consider the 8 year growth rate of both EPS and SPS. The function I developed to calculate the historical growth rate does not simply calculate either the average or compound growth rate of the 8 years, it considers the annual growth rate year on year. It shows that EPS grew by 9.37% year on year wheres the SPS grew slightly lower at 8.10% per year. Both the EPS and SPS grew at rates higher than the average South African medium-term inflation rate (roughly 6%).
The high stability scores, as well as the growth rates higher than medium-term inflation rates, are the first indicators that BCF has a durable competitive advantage. The figures below show respectively EPS vs. EPS Growth and SPS vs. SPS Growth for BCF.
BCFs EPS stability is 86% which indicates a high level of stability given that we have just come through the biggest world-wide recession of the last 80 years. BCFs sales per share stability is even higher at 93% indicating that even during the recession, the sales activity continued to be stable.
Next we consider the 8 year growth rate of both EPS and SPS. The function I developed to calculate the historical growth rate does not simply calculate either the average or compound growth rate of the 8 years, it considers the annual growth rate year on year. It shows that EPS grew by 9.37% year on year wheres the SPS grew slightly lower at 8.10% per year. Both the EPS and SPS grew at rates higher than the average South African medium-term inflation rate (roughly 6%).
The high stability scores, as well as the growth rates higher than medium-term inflation rates, are the first indicators that BCF has a durable competitive advantage. The figures below show respectively EPS vs. EPS Growth and SPS vs. SPS Growth for BCF.
 |  |
I particularly look for stocks that have stability percentages of 80 percent or more for both their earnings and their sales. If a company does not satisfy this criterion, I usually just pass it by. After all, if there was little stability in sales and earnings in the past, then it becomes virtually impossible to make confident forecasts for the future.
BCF pass this criteria.
BCF pass this criteria.
Average ROE and ROIC of the business
I like companies with above average Return on Equity (ROE) of at least 18% or better, as this is another indicator that the company has a durable competitive advantage. Because some companies can be financed with debt that is many times their equity, they can show a consistently high ROE, yet still be in unattractive price competitive businesses. To screen out these companies I consider a companies Return on Invested Capital (ROIC), which must be higher than 15% and it must be higher than the Weighted Average Cost of Capital (WACC) of the company.
I like companies with above average Return on Equity (ROE) of at least 18% or better, as this is another indicator that the company has a durable competitive advantage. Because some companies can be financed with debt that is many times their equity, they can show a consistently high ROE, yet still be in unattractive price competitive businesses. To screen out these companies I consider a companies Return on Invested Capital (ROIC), which must be higher than 15% and it must be higher than the Weighted Average Cost of Capital (WACC) of the company.
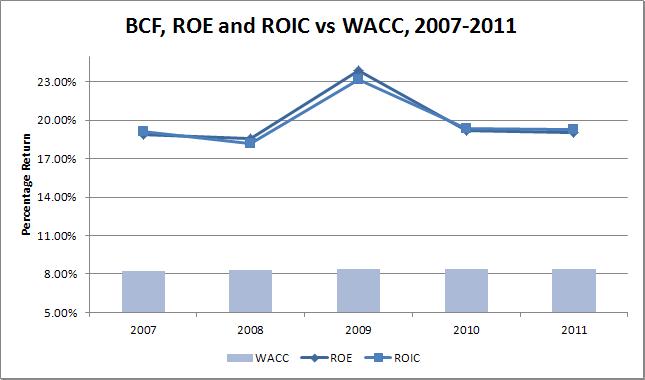 | If a company that can maintain its ROIC consistently above its WACC is creating value for its shareholders. A company that has a ROIC lower than its WACC, irrespective of the rate of growth of the company, is destroying value. In fact, when ROIC is smaller than WACC, then the faster the company grows the faster it is destroying value! |
Calculating the WACC of a business could be a complex task. There are many different ways of calculating the Cost of Equity and the Cost of Debt of a business. The calculations for BCFs WACC is not displayed here, but if required please email me (see the contact me form) and I will gladly supply the calculations (and the thinking). Suffice it to say, that with a BETA of between -0.01 and 0.01 one can assume that BCFs WACC should be very close to the South African Risk Free Rate (which I assume, most of the time, to be 8.5%).
BCFs average ROE over the last five years was 19.9% and its average ROIC over the same period was 19.83%. The average ROE is higher than the required 18% and the average ROIC is higher than the required 15%. Furthermore, the ROIC is much higher than the average WACC of 8.36%. Therefore, management is creating value for shareholders at a good pace.
The consistently high ROE and ROIC rates is the second indicator that BCF has a durable competitive advantage.
BCF pass this criteria.
Corporate Stability of the business
I like companies that demonstrate a high level of corporate stability over the long term. The functions I have developed to measure corporate stability consider a number of different financial ratio's of a firm to determine a stability score. A high corporate stability score is required before considering any investment in the company.
I like companies that demonstrate a high level of corporate stability over the long term. The functions I have developed to measure corporate stability consider a number of different financial ratio's of a firm to determine a stability score. A high corporate stability score is required before considering any investment in the company.
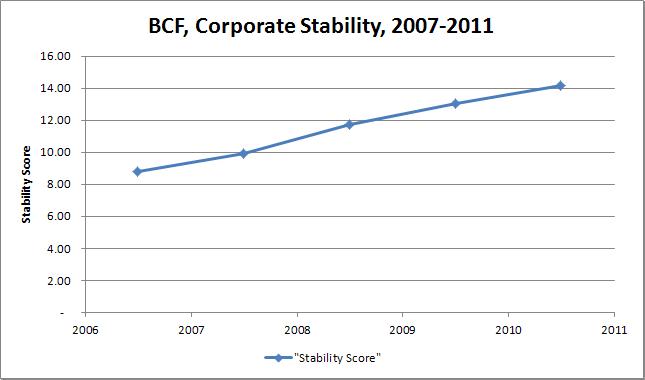 | A score above 8.15 indicates little chance of the business failing based on current management principles. The average stability score for BCF over the last five years has been 11.54 which is much higher than the required 8.15 for a very stable company. |
This is the kind of company I like to invest in, because it has a good chance of still doing what it is doing, and being in business, 10 years from now. BCF is the kind of business I can invest in and forget about, come back in ten years, and it is still going strong.
The consistently stability score is the third indicator that BCF has a durable competitive advantage.
BCF pass this criteria.
The consistently stability score is the third indicator that BCF has a durable competitive advantage.
BCF pass this criteria.
Capital expenditure of the business
I like companies that do not have major capital expenditures, i.e. I look for companies that do not need to spend a lot of money on major upgrades of plant and equipment or on research and development to stay competitive.
BCFs free cash flow per share of 57, 90, 105, 69 cents over the past four years are all positive, indicating that the company is generating more cash that it is consuming. This is a favorable sign, and so the company passes this criterion.
BCF pass this criteria.
Debt position of the business
I like businesses that are conservatively financed. Nonetheless, I am willing to invest in firm with solid bond ratings. In South Africa it is not always easy to obtain a bond rating for a firm, and therefore I have developed functions that calculate a synthetic bond rating based on the fundamentals of the business. BCFs synthetic bond rating is calculated as "AAA" based on both its corporate stability rating and the fact that its interest cover ratio is very, very high. In fact, BCF shows R16 500 000 of debt on its balance sheet (31 June 2011), and earnings of R 77 000 000 (31 June 2011). Therefore, it is able to take some of its R77m profit and pay off its debts in one go if it has to, which is considered exceptional.
BCF pass this criteria.
Use of Retained Earnings by the business
This is one of Buffett's main screening criteria, and I love it was well. Buffett likes to see if management has spent retained earnings in a way that benefits shareholders. To determine this, Buffett takes the total amount of retained earnings over the previous eight years of R 4.14 per share and compares it to the gain in EPS over the same period of 37.9 cents. BCFs management has proven it can earn shareholders a 9.16% return on the earnings they kept.
This return is average, and slightly higher than the South African Risk Free Rate. Essentially, management is doing a OK job putting the retained earnings to work, but by no means a fantastic job.
BCF has a No Fail on this criteria, but it is not a pass.
This concludes the quantitative elements of the Phase I valuation. Next the valuation moves to Phase II.
Phase II: should I buy based on the economics?
If and when I get positive responses to all the above criteria, I then proceed with a value vs. price analysis. The value analysis will determine whether or not the stock should be bought. The following is how I evaluate BCF quantitatively.
I start by understanding the intrinsic value of the business from the perspective of the Balance Sheet, Income Statement, and finally the Free Cash Flow.
I start by understanding the intrinsic value of the business from the perspective of the Balance Sheet, Income Statement, and finally the Free Cash Flow.
Intrinsic Value of the business - Balance Sheet
The first step in a Graham valuation is to calculate the asset value of the firm. Many (traditional) value investors see this as the only step to follow. I like to calculate the Asset Replacement Value for the firm. In BCFs case I started with the actual Balance Sheet (BS) for the last five years. Each of the rows in the BS is adjusted by the factor to produce the replacement BS.
The first step in a Graham valuation is to calculate the asset value of the firm. Many (traditional) value investors see this as the only step to follow. I like to calculate the Asset Replacement Value for the firm. In BCFs case I started with the actual Balance Sheet (BS) for the last five years. Each of the rows in the BS is adjusted by the factor to produce the replacement BS.
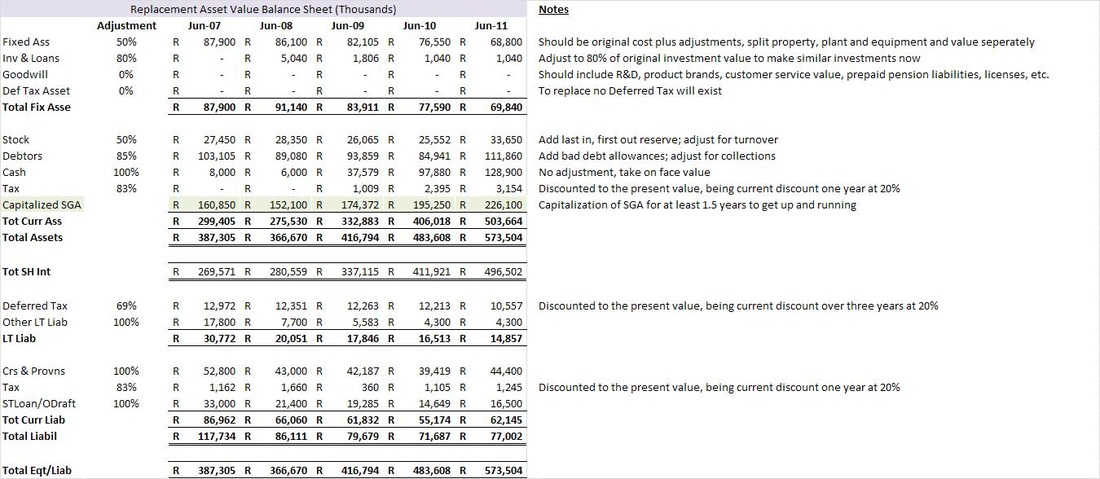
The Adjustment column shows the percentage adjustment made for each line item from the original published BS. The Notes column at the end shows why an adjustment was made for an item. The Tot SH Int row shows the Adjusted Book Value for BCF for the years displayed. On a per share basis the Adjusted Book Value per Share is 308, 321, 403, 513, 617 (all values in cents) with each value corresponding to the year 2007 to 2011. This is my intrinsic Balance Sheet values for BCF.
Intrinsic Value of the business - Income Statement
Understanding the value of the business from the Income Statements (IS) perspective helps me to understand how hard BCFs management is sweating their assets, i.e. are they managing to grind their assets harder in order to make good returns with the assets they own. I start by looking at BCFs Return on Assets (ROA). BCFs annual ROA over the last five years was 12.58%, 13.78%, 18.65%, 15.68%, 15.83% with an average of 15.30%. This shows that BCF has been able to work their assets hard.
Understanding the value of the business from the Income Statements (IS) perspective helps me to understand how hard BCFs management is sweating their assets, i.e. are they managing to grind their assets harder in order to make good returns with the assets they own. I start by looking at BCFs Return on Assets (ROA). BCFs annual ROA over the last five years was 12.58%, 13.78%, 18.65%, 15.68%, 15.83% with an average of 15.30%. This shows that BCF has been able to work their assets hard.
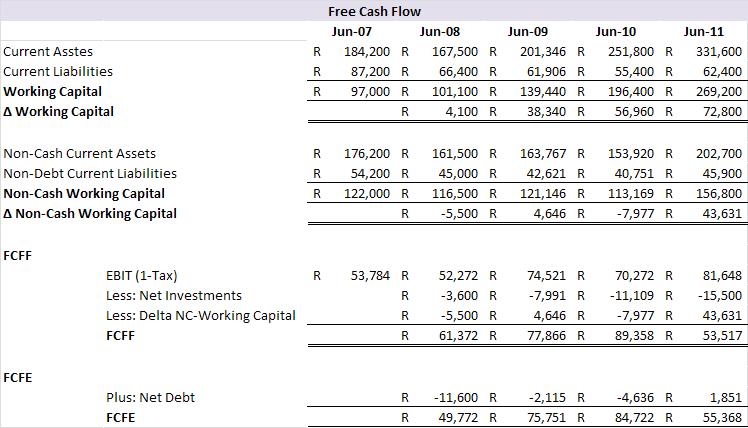
The free cash flow calculations indicate positive free cash flow to both Firm and Equity holders for the last five years. To understand, from the perspective of a value investor, the Earnings Power Value (EPV) of the business, I start by taking the Free Cash Flow to Equity Holders (FCFE) and capitalizing it by the cost of equity (if I worked with the Free Cash Flow to the Firm I would have used to WACC to capitalize the free cash flow).
Calculating the BCFs EPV yields 673, 1071, 1248, 814 cents per share with each value corresponding to the year 2008 to 2011. This is my intrinsic Income Statement values for BCF.
Calculating the BCFs EPV yields 673, 1071, 1248, 814 cents per share with each value corresponding to the year 2008 to 2011. This is my intrinsic Income Statement values for BCF.
Intrinsic Growth Value of the business - Discounted Cash Flow (DCF)
Most value investors don't even attempt to perform a DCF valuation. I do it to see what the possible, yet conservative, upside value of the business could be. Therefore, a DCF of BCF gives me the top or maximum intrinsic value per share. The figure below shows the DCF performed for BCF. I assumed higher growth for the next ten years (very conservative at 6% per year) with a long-term growth rate of 4%. I used the forward-looking WACC to calculate the discount rates.
Most value investors don't even attempt to perform a DCF valuation. I do it to see what the possible, yet conservative, upside value of the business could be. Therefore, a DCF of BCF gives me the top or maximum intrinsic value per share. The figure below shows the DCF performed for BCF. I assumed higher growth for the next ten years (very conservative at 6% per year) with a long-term growth rate of 4%. I used the forward-looking WACC to calculate the discount rates.
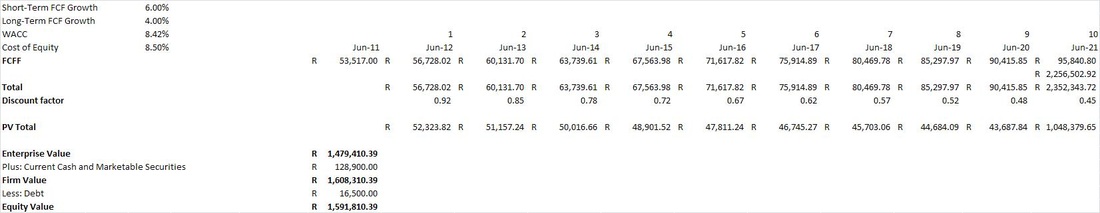
At the bottom of the figure the Enterprise, Firm and Equity value of BCF is displayed. Based on the Equity value calculated the intrinsic value per share is calculated at 1978 cents. When I perform the DCF but starting from the FCFE perspective, I obtain an intrinsic value of 1866 cents per share. These numbers should be the same, and I can accept in this case that they are sufficiently close together to show that the calculations are sound.
Intrinsic Value - putting it all together
From the exercise above we have obtained three different values for BCF. I usually also do a Graham Valuation as described in Chapter 39 of his 1962 Security Analysis. The value (which is based on earnings) is calculated for BCF using Graham's approach and is shown in as the middle bar in the graph below. Note that BS shows the Replacement Asset intrinsic value. IS shows the Earnings Power Value. FCFF and FCFE respectively show the DCF value form the perspective of mentioned.
From the exercise above we have obtained three different values for BCF. I usually also do a Graham Valuation as described in Chapter 39 of his 1962 Security Analysis. The value (which is based on earnings) is calculated for BCF using Graham's approach and is shown in as the middle bar in the graph below. Note that BS shows the Replacement Asset intrinsic value. IS shows the Earnings Power Value. FCFF and FCFE respectively show the DCF value form the perspective of mentioned.
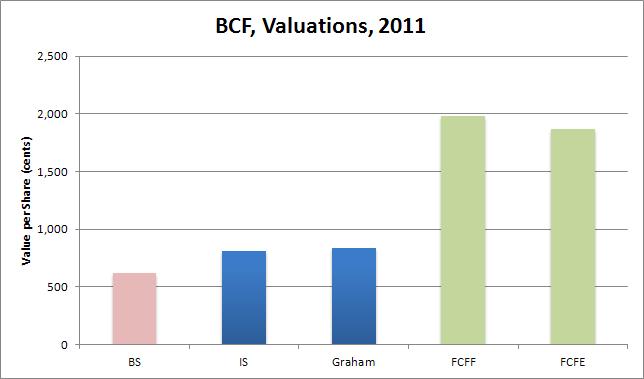
What is important to note in this graph is that BS is less than IS and BS is also less than Graham. This is the fourth and final indicator that the business enjoys a durable competitive advantage. Furthermore, IS and Graham are both less that the valuation considering growth, i.e. FCFF and FCFE. The bars in this chart show the classic style of a company with a durable competitive advantage: they sweat their assets very hard and therefore have a consistent gap between asset values and earnings values. This graph only shows the valuations for 2011, but in my analysis this gap is positive for the last five years.
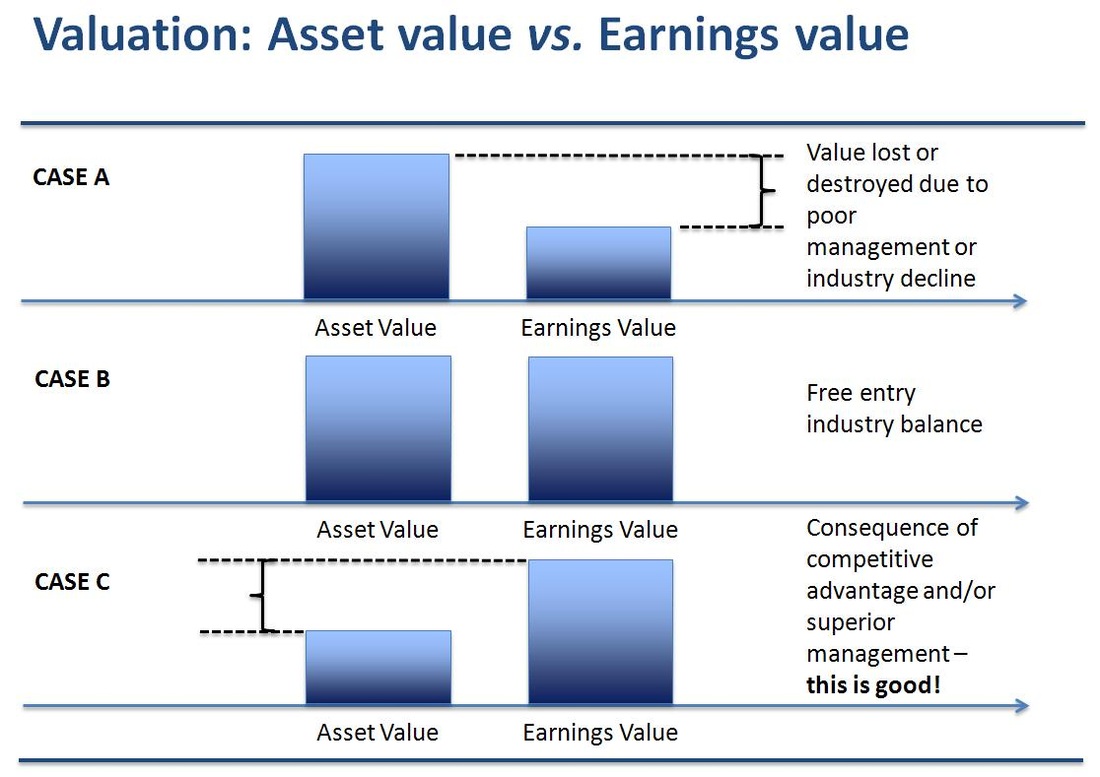
Prof. Bruce Greenwald, in his book Value Investing: From Graham to Buffett and Beyond, defines the details of the relationship between asset value (BS) and earnings power value (IS and Graham) and how this, if the relationship is consistent, is an indication that the firm has durable competitive advantage (see the figure below for simple explanation).
Prof. Bruce Greenwald, in his book Value Investing: From Graham to Buffett and Beyond, defines the details of the relationship between asset value (BS) and earnings power value (IS and Graham) and how this, if the relationship is consistent, is an indication that the firm has durable competitive advantage (see the figure below for simple explanation).
Based on the analysis above a fair price to pay for BCF (at the end of June 2011) would be somewhere near R 8.50 per share. Paying more than that would imply paying for potential growth, not something a value investor likes to do. To be honest, a value investor likes to buy assets at a discount (and so do I). Therefore, a value investors buy price would be 75% of the fair value: R 6.38 = R 8.50 x 75%.
In order to make the final investment decision I have to consider what my potential return on investment (ROI) could be if I bought at either R 6.38 and R 8.50. In order to do that I have to determine what the possible future share price could be in 10 years time, using the information I have already gathered and analysed on BCF.
In order to make the final investment decision I have to consider what my potential return on investment (ROI) could be if I bought at either R 6.38 and R 8.50. In order to do that I have to determine what the possible future share price could be in 10 years time, using the information I have already gathered and analysed on BCF.
Based on valuations what is the expected return in 10 years?
The final step in the valuation is to determine what the expected share price value could be in 10 years time given the current book value, earnings per share (EPS), payout ratio, P/E ratio, and EPS growth rate. I perform two calculations to determine the possible future share price. The first method starts from the perspective of ROE and the second starts from EPS.
The ROE method starts by determining the average payout ratio. I calculated it as 24.04%. I calculated the average ROE for BCF as 19.90%. This provides the average ROE after payout at 15.11%. Using this as an estimated equity growth rate (based on the relationship to estimate fundamental growth rates = Retention Ratio x ROE) I calculate the equity per share in 10 years to be R 20.69. This yields, given the average ROE, EPS in 10 years of R 4.12. I then calculate the expected price per share in 10 years (using the average P/E over the last 8 years) as R 39.95. Note that to calculate the final share price I add the cumulative expected dividend per share for the 10 future years. Finally, I calculate the expected compound growth rate between R 8.50 (current share price) and R 39.95 (possible future share price in 10 years) as 16.74%. If, however, I calculate the compound annual growth rate between R 6.38 (the margin-of-safety buy price) and R 39.95 it yields 20.13% return.
The second method starts by estimating the future EPS in 10 years using the EPS growth rate calculated earlier. This yields EPS in 10 years of R 2.36. Using this estimated EPS I calculate the possible future share price as R 24.55 (using a similar method as described in the paragraph above). Finally, I calculate the expected compound growth rate between R 8.50 (current share price) and R 24.55 (possible future share price in 10 years) as 11.19%. If, however, I calculate the compound annual growth rate between R 6.38 (the margin-of-safety buy price) and R 24.55 it yields 14.43% return.
Interpreting the results
The final step is to review the results. Based on my calculations I can show the following:
The final step is to review the results. Based on my calculations I can show the following:
- buying BCF at R 8.50 could yield a possible return of between 16.74% and 11.19%, with an average of 13.96%. This presents a good investment opportunity.
- buying BCF at R 6.39 could yield a possible return of between 20.13% and 14.43%, with an average of 17.28%. This presents a great investment opportunity.
My recommendation therefore is to buy BCF at prices from R 8.50 and below.
I would suggest buying BCF at prices from R 8.50 and below. I would not pay more than R 8.50 per share for BCF due to the declining expected future return.
I hope you have enjoyed this first valuation exercise. This is the first of many and will try and post one every couple of weeks. I plan to adjust, or add to, some of my investment criteria with following posts. I also plan to elaborate on the thinking behind the investment criteria with follow-up posts. This will allow people following these posts to gain an understanding of my thinking.
Please feel free to contact me in case you have any additional questions or suggestions regarding the valuation.
Be extraordinary!
Myles Rennie
P.S. The above analysis should not be considered investment advice. I will not be held liable for any investment decisions, or investments, made based on my analysis.
 RSS Feed